All tools
Showing 15 of 15 tools

A quiet, beautiful thing for when you've lost someone.
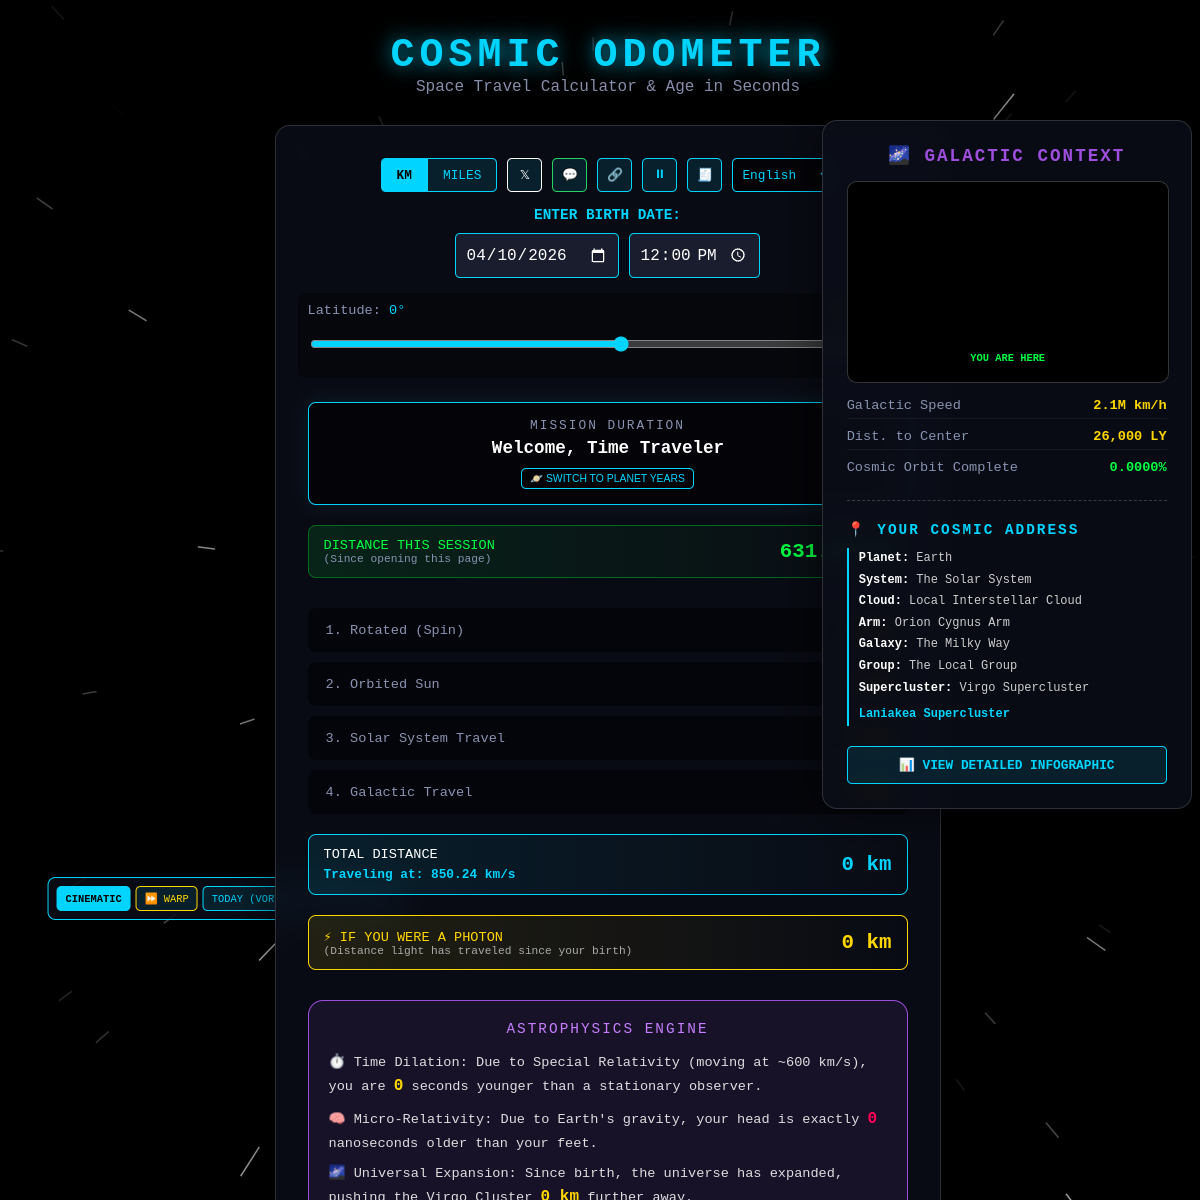
Shows how far you've traveled through space since you were born.
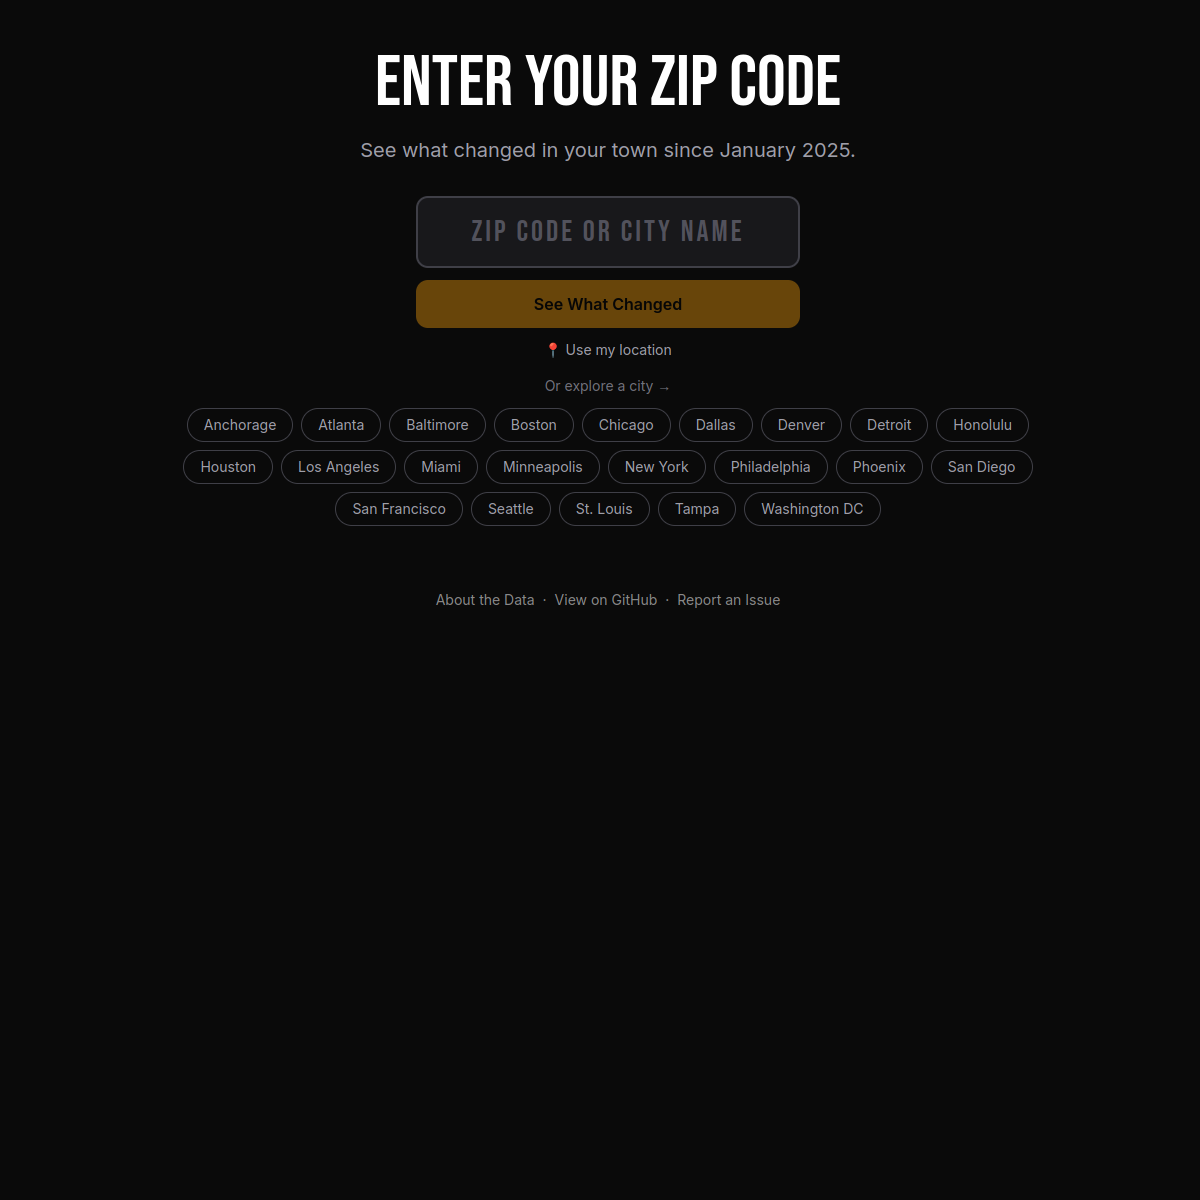
See how much prices have moved in your city since January 2025.

Trace how English, Hindi, and 400+ other languages all came from one ancestor.

Garrett Lisi's interactive visualization of matter's intrinsic degrees of freedom. Spin beautiful geometric structures that represent fundamental physics.
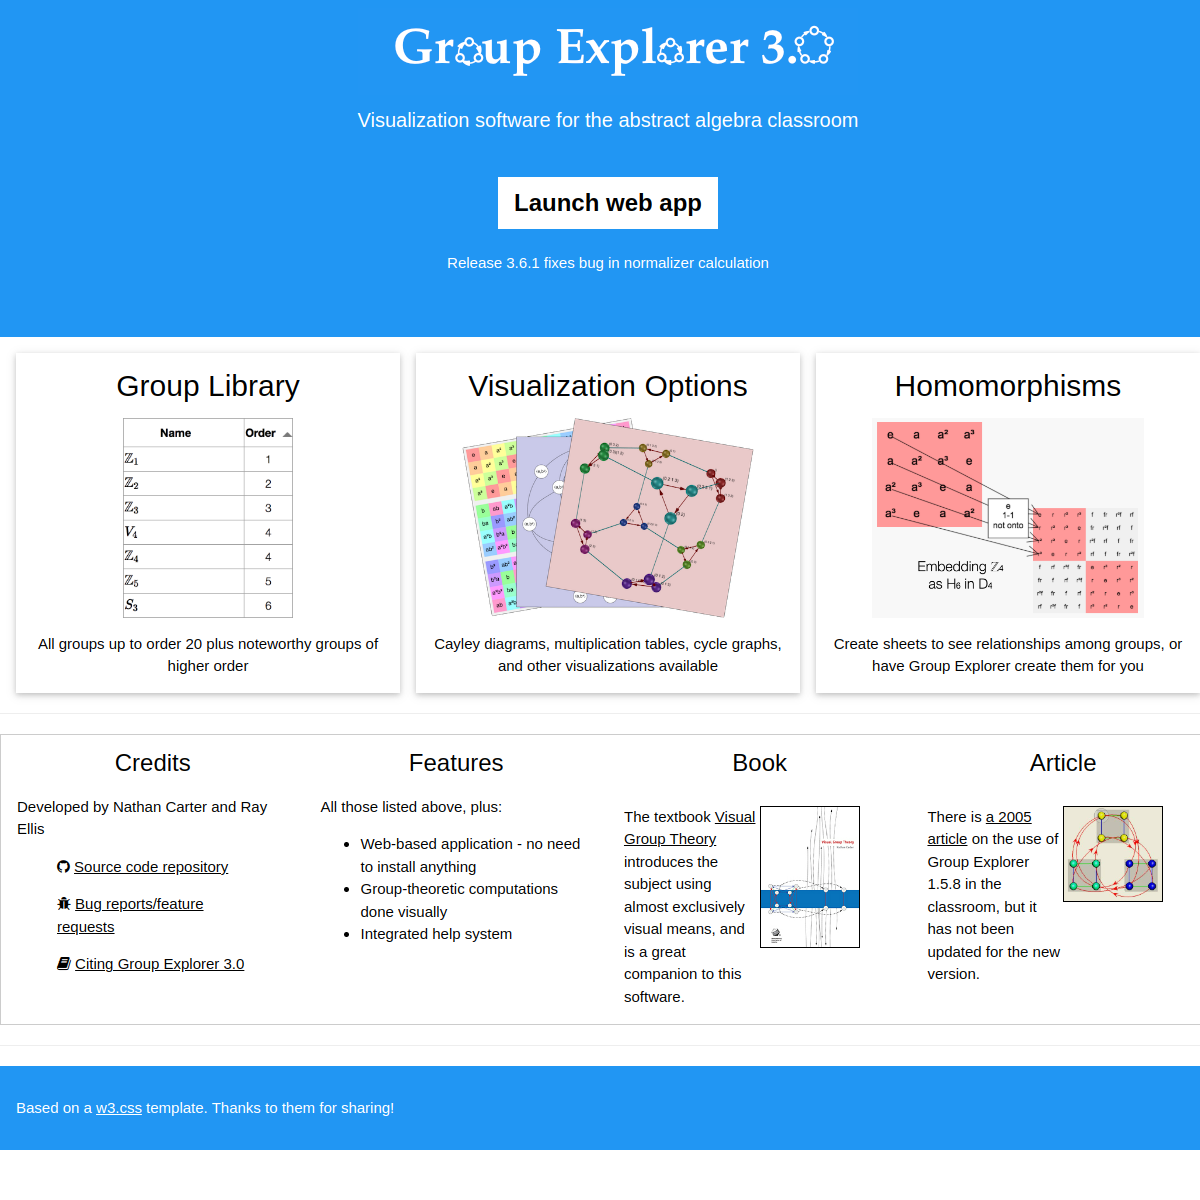
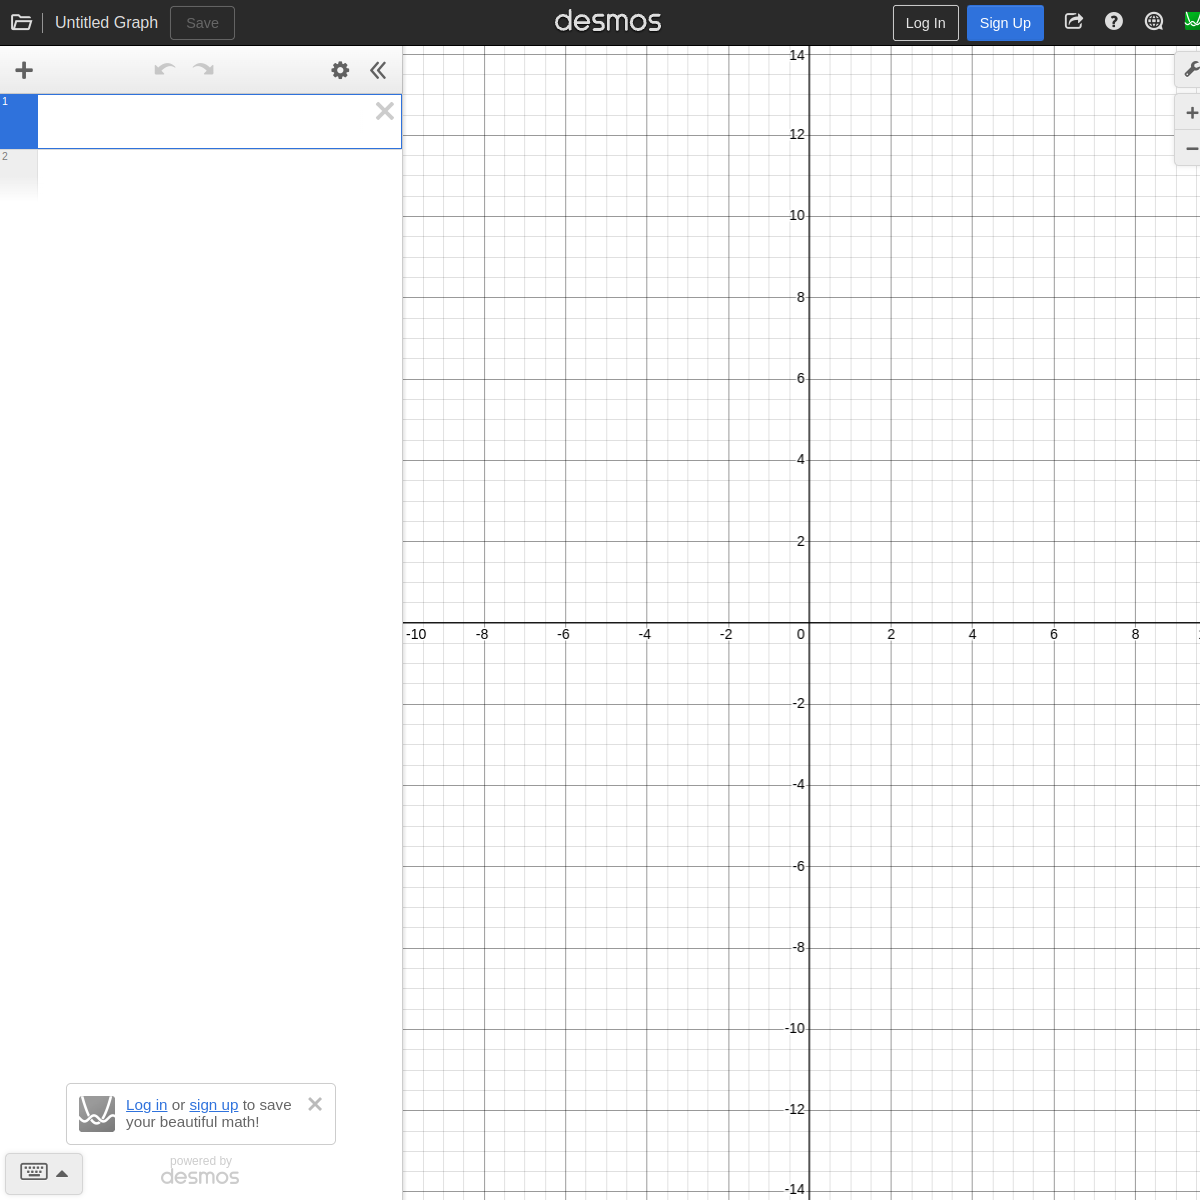
Visualization software for abstract algebra. Explore symmetry groups, Cayley diagrams, and multiplication tables interactively. A mathematician's playground.
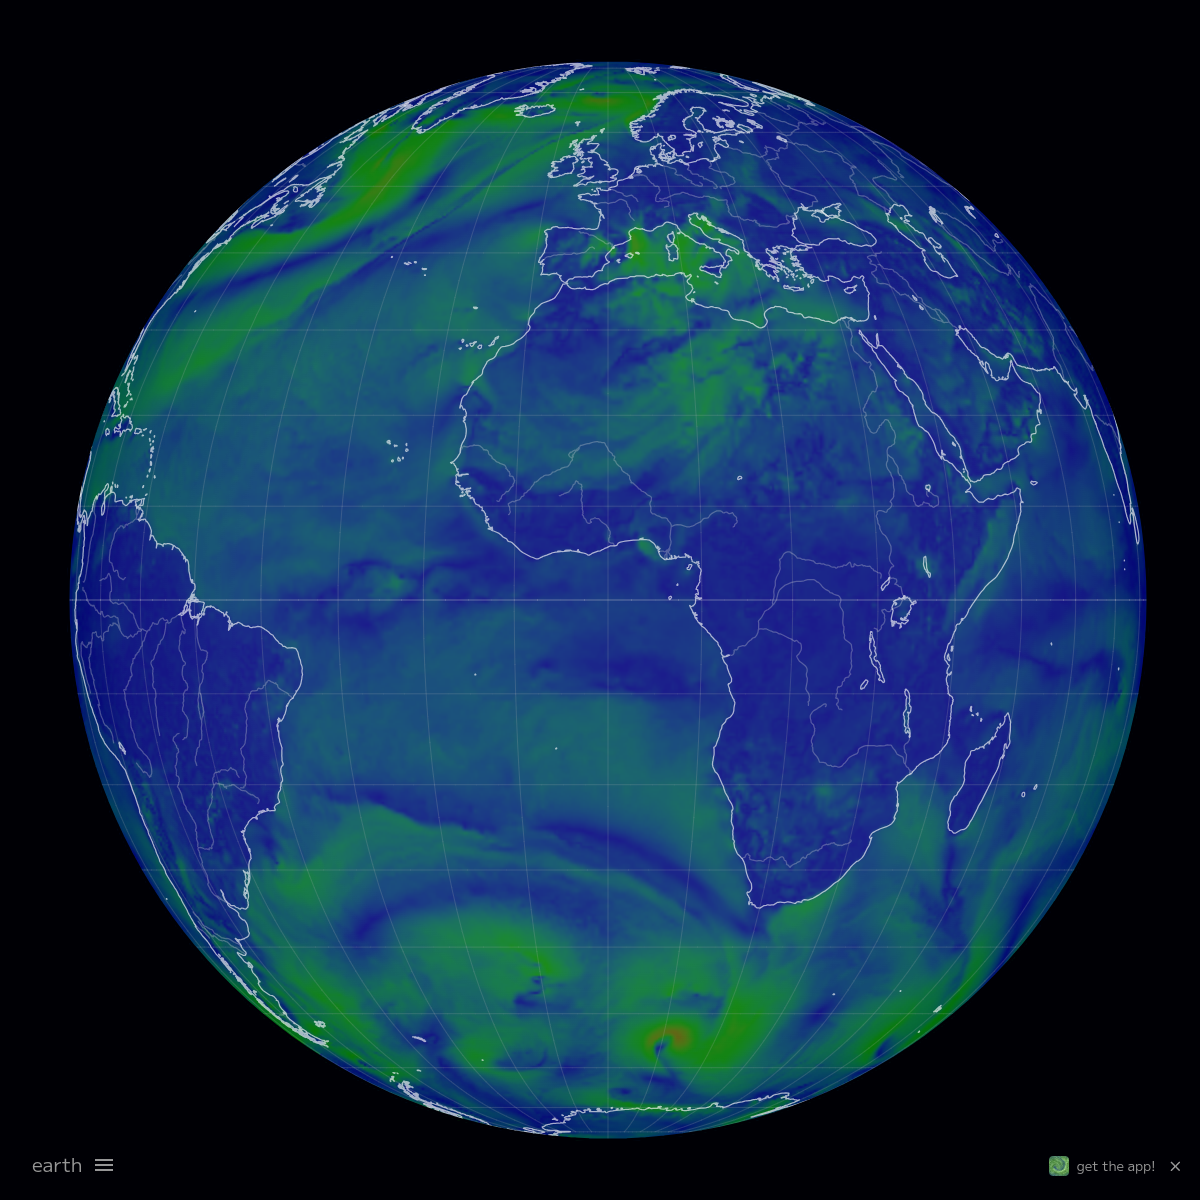
3D globe showing real-time wind, temperature, and ocean currents.
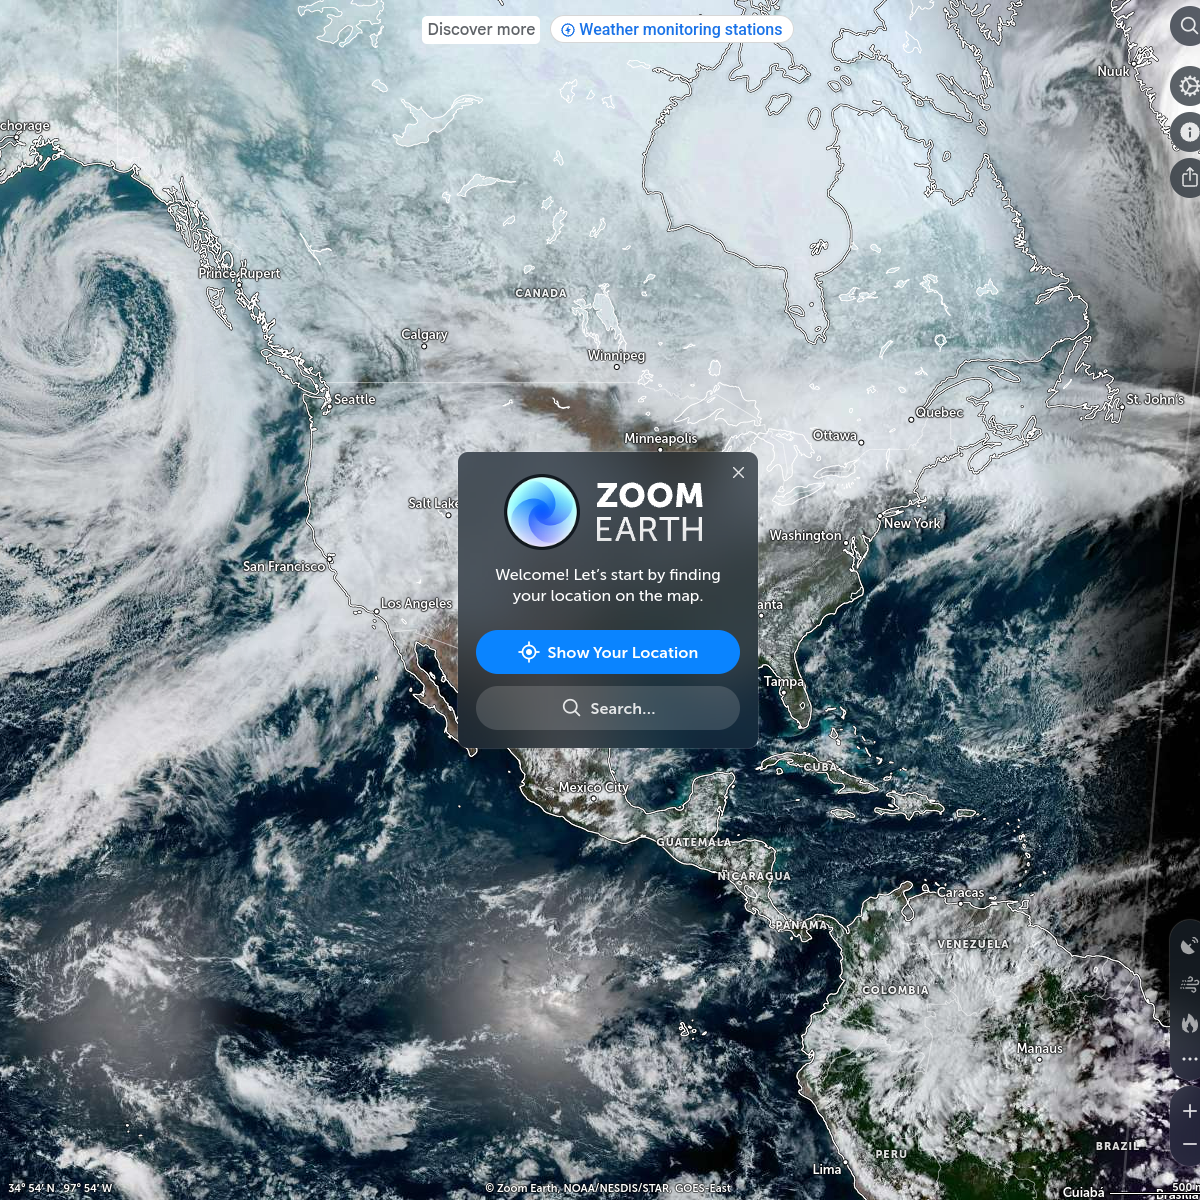
Live satellite imagery with storm tracking and weather overlays.
Data visualizations and infographics about business and markets.
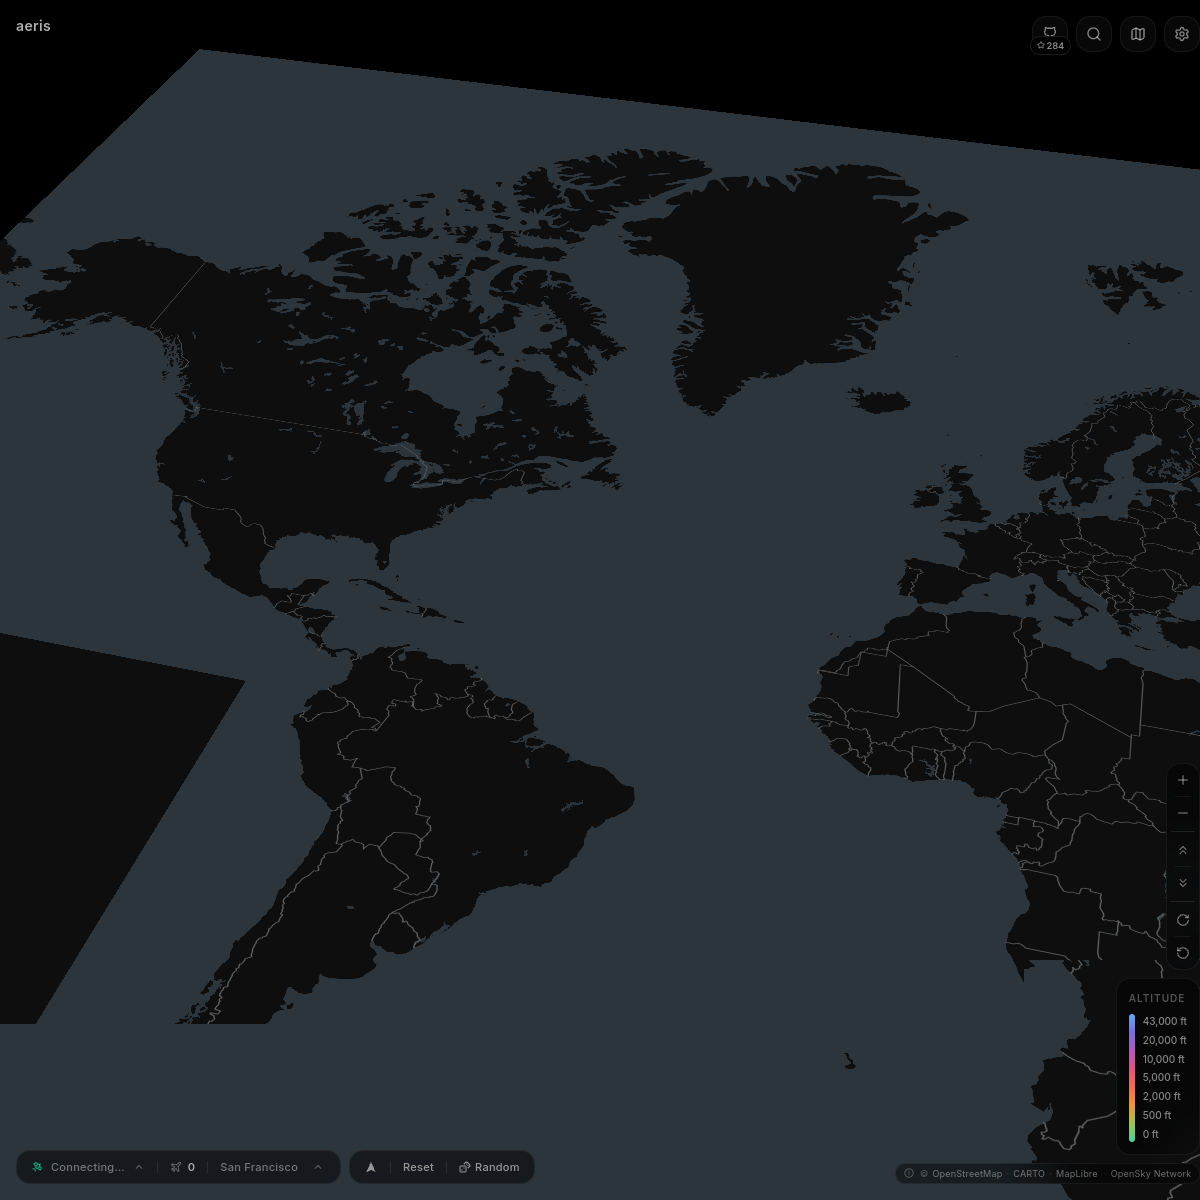
A flight tracker that separates planes by altitude using colors. Strangely satisfying to watch the rush at airports visually.
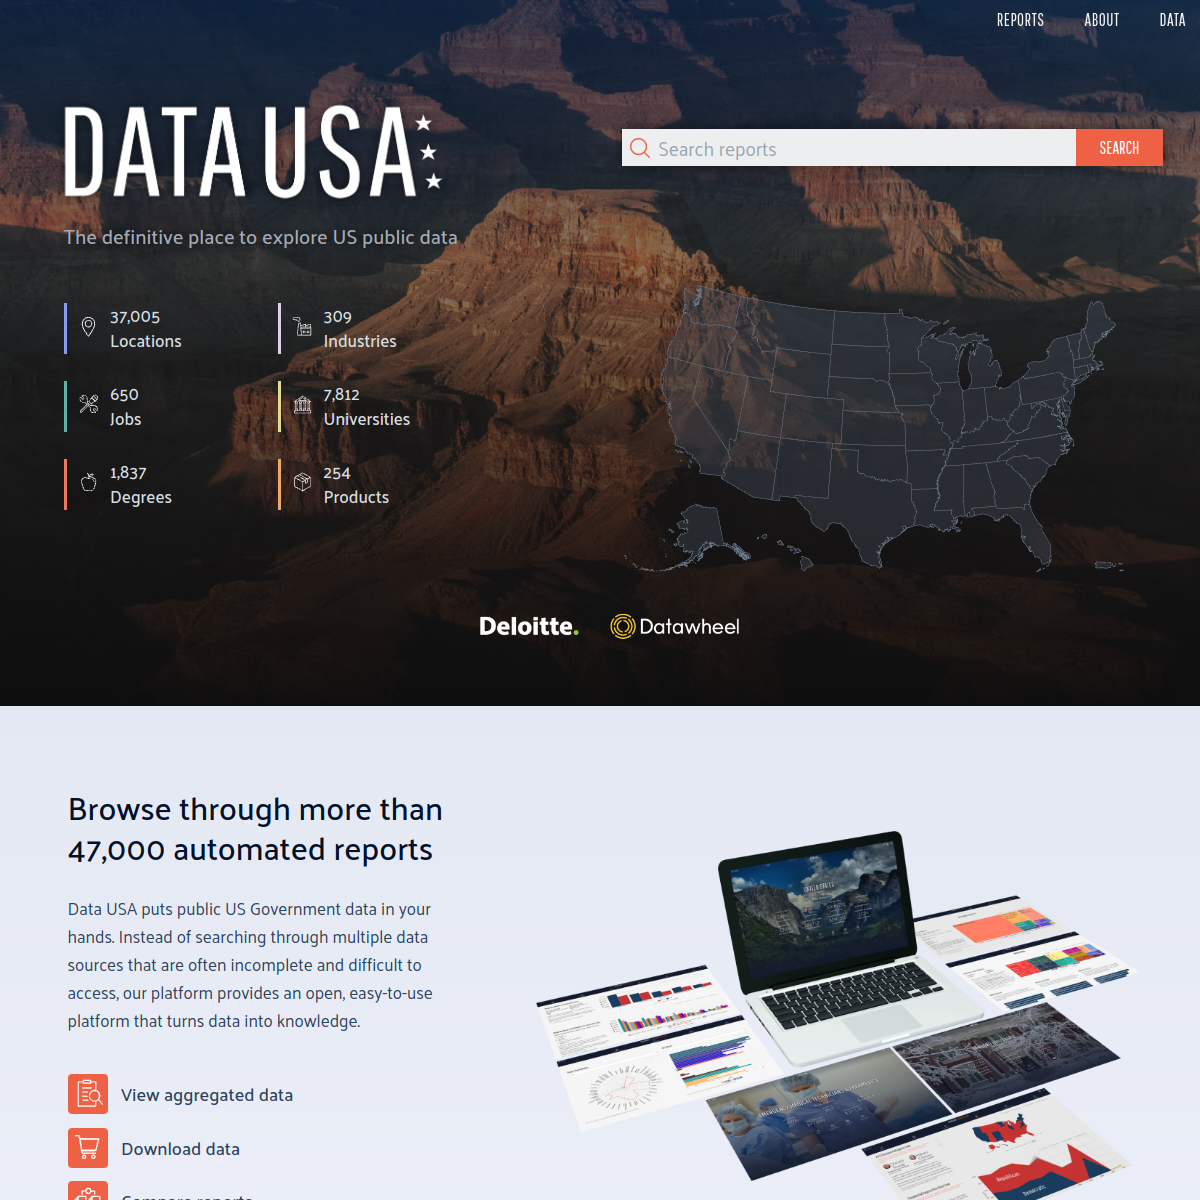
Visualization of public U.S. data on jobs, education, health, and more.
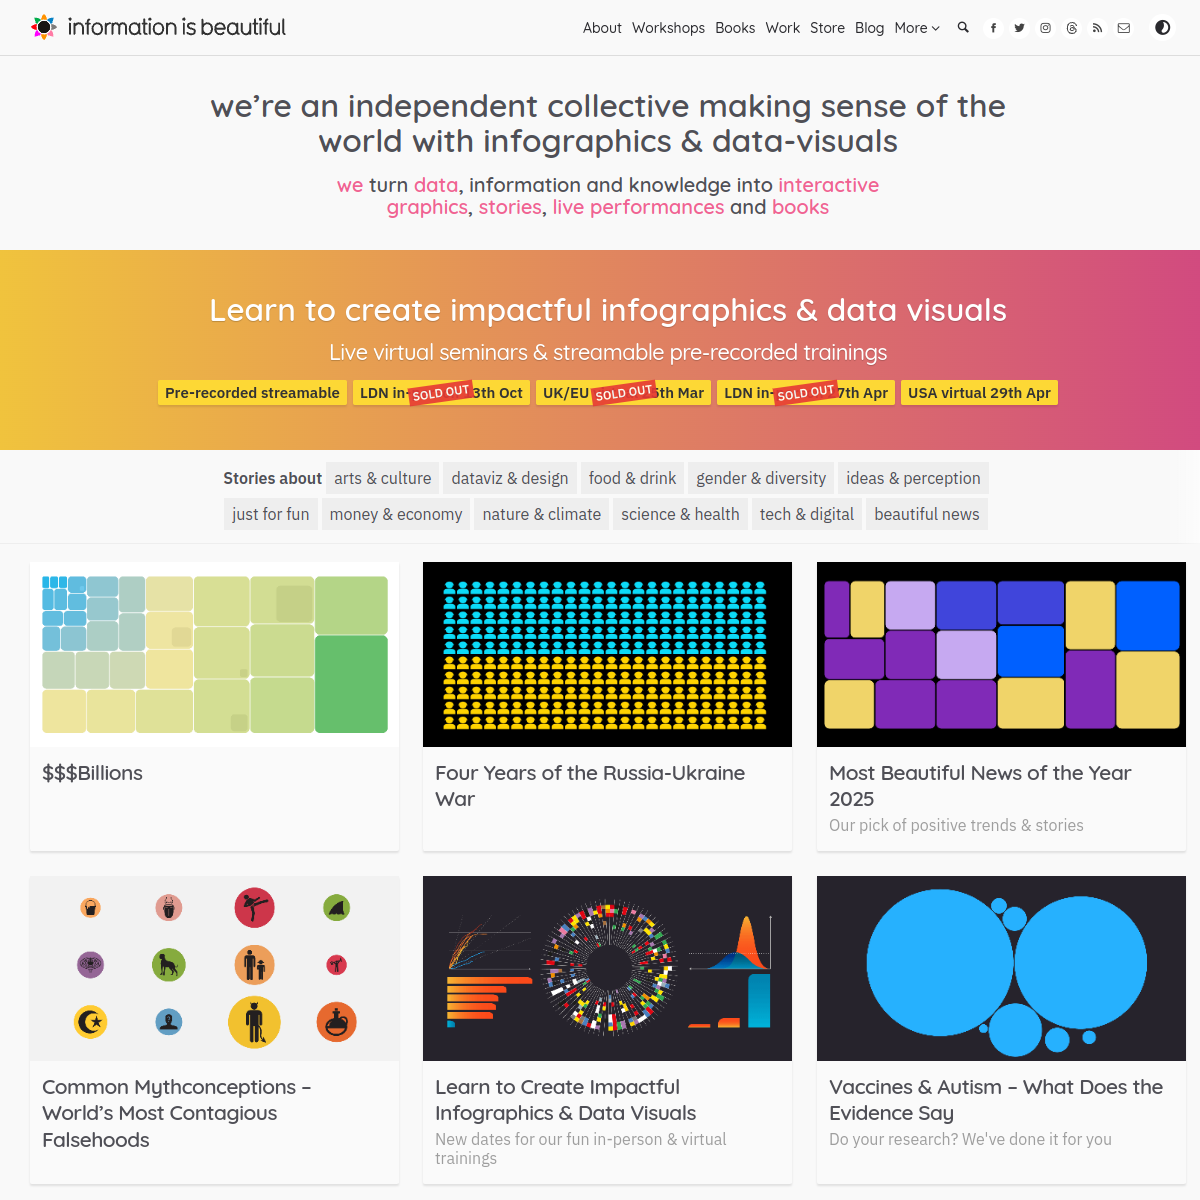
Infographics and data visualizations on global issues and trends.

That's all of them so far.
Got something to add? Submit yours →