Free data tools
CSV converters, chart generators, JSON pretty-printers, data visualizers, and spreadsheet helpers — for the moments when Excel is too much and a text editor isn't enough.
33 tools · sorted by community upvotes · browse all
What Changed
See how much prices have moved in your city since January 2025.

Doomsday Tracker
A list of every end-of-the-world prediction that was wrong.

Indo-European Explorer
Trace how English, Hindi, and 400+ other languages all came from one ancestor.
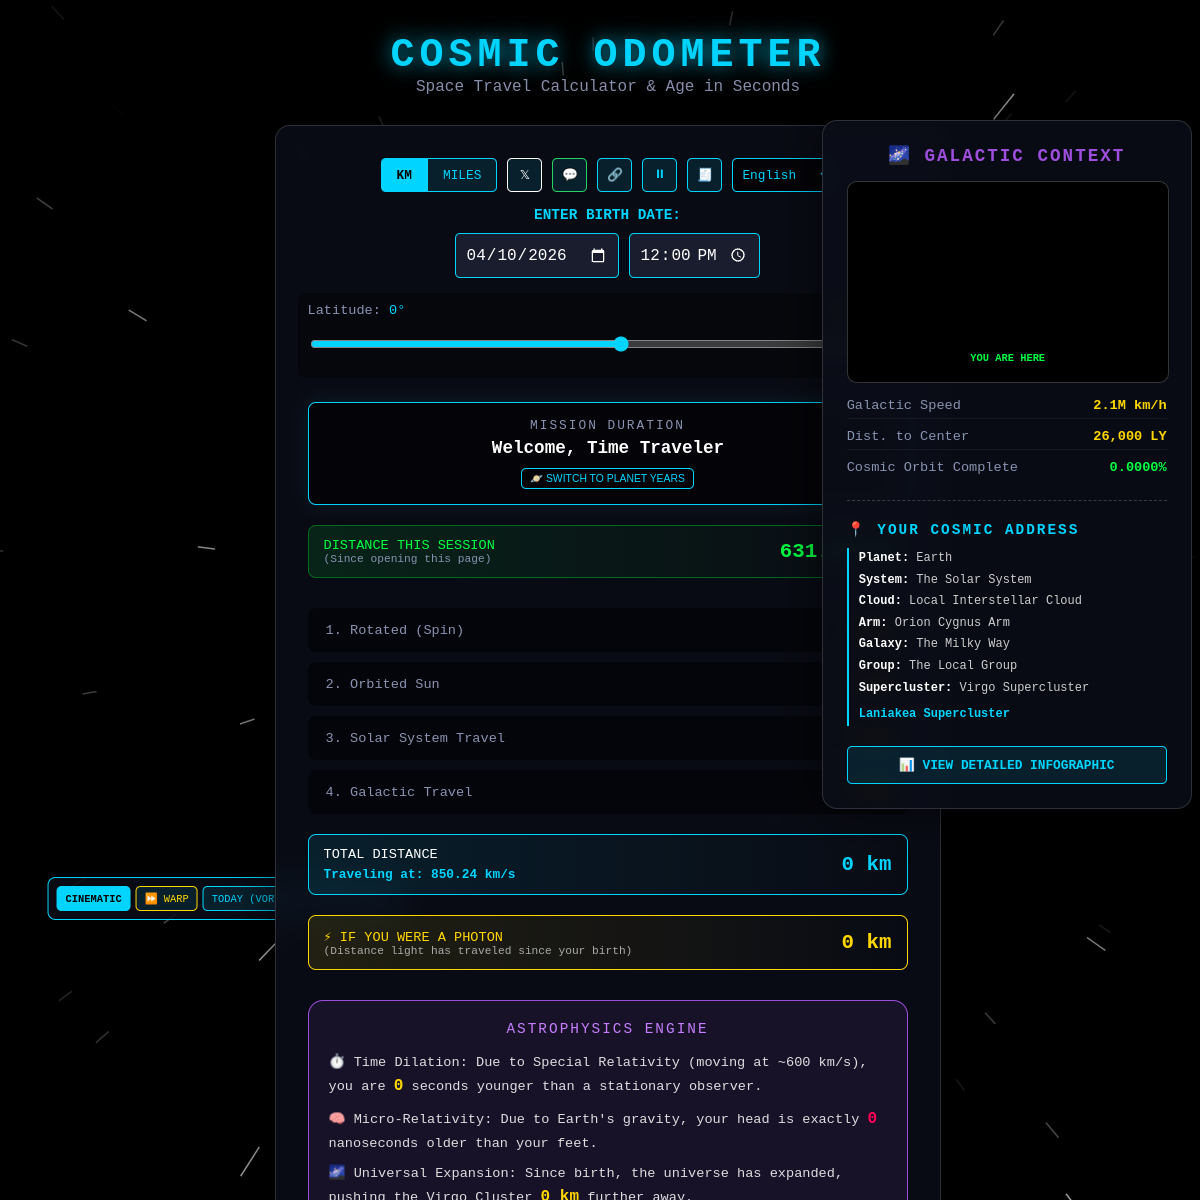
Cosmic Odometer
Shows how far you've traveled through space since you were born.
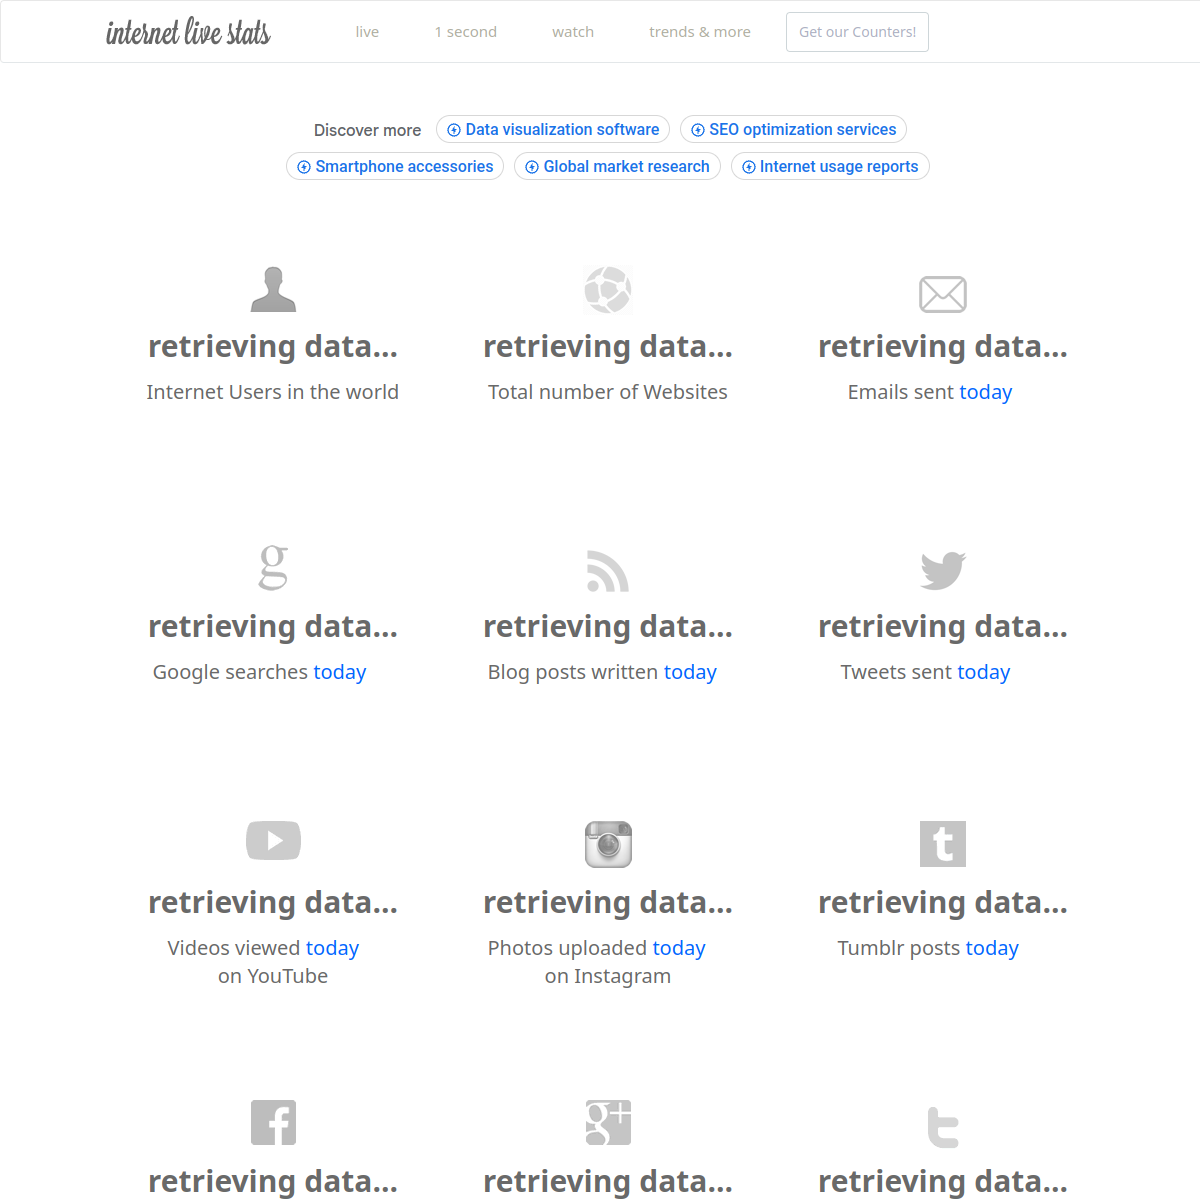
Internet Live Stats
Real-time statistics about the internet: users, websites, traffic, and more.
Visual Capitalist
Data visualizations and infographics about business and markets.
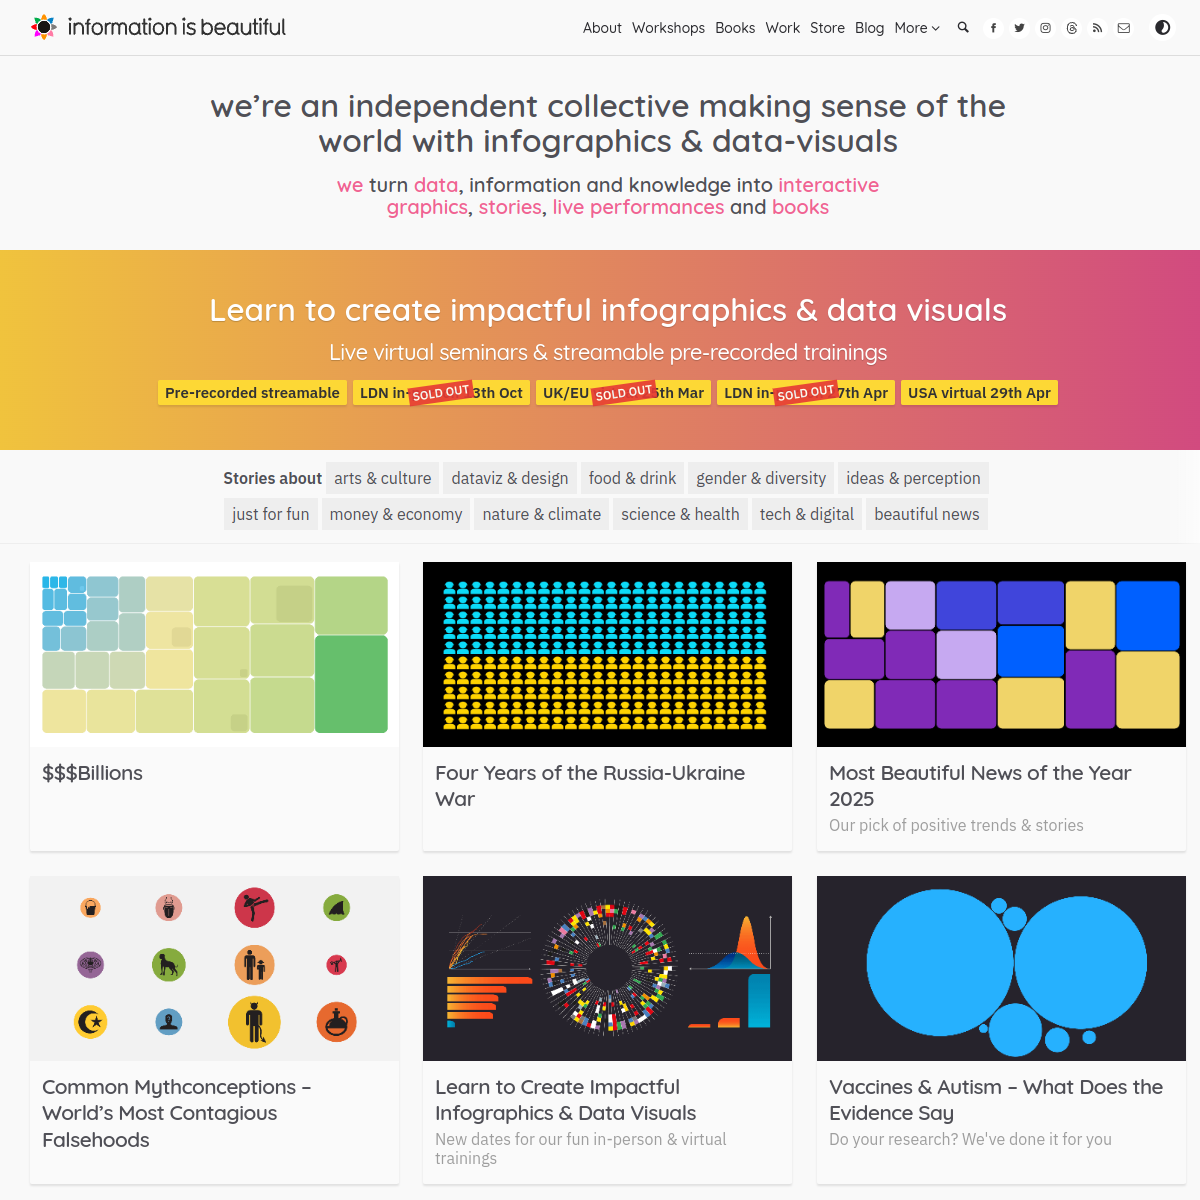
Information is Beautiful
Infographics and data visualizations on global issues and trends.
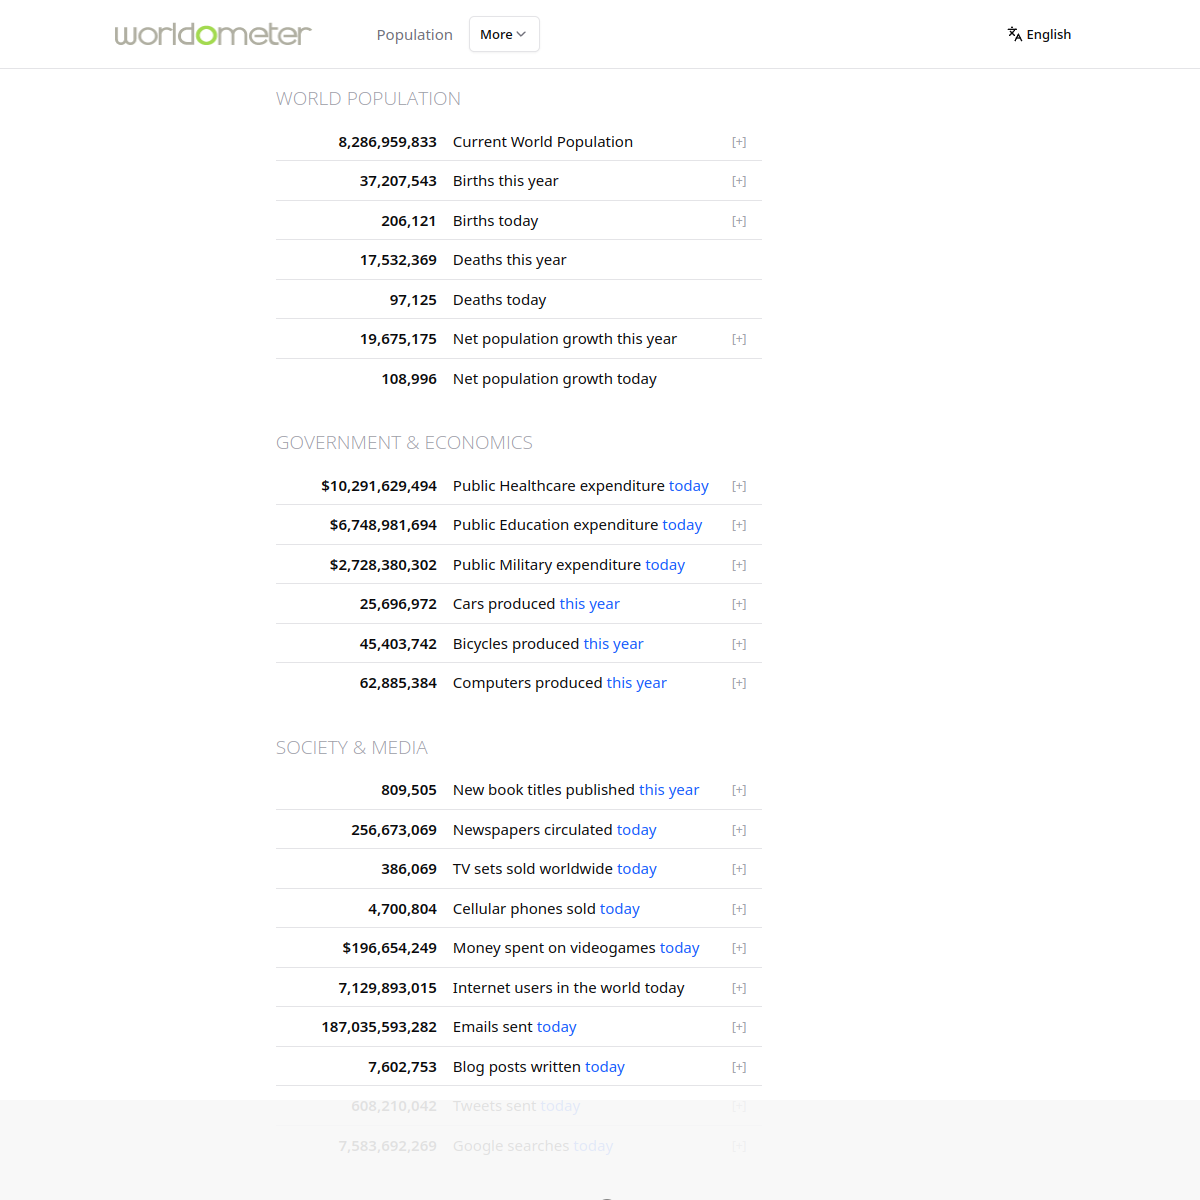
Worldometer
Real-time world statistics — population, births, deaths, CO2 emissions, internet users, and more. Watch the numbers tick up in real time.
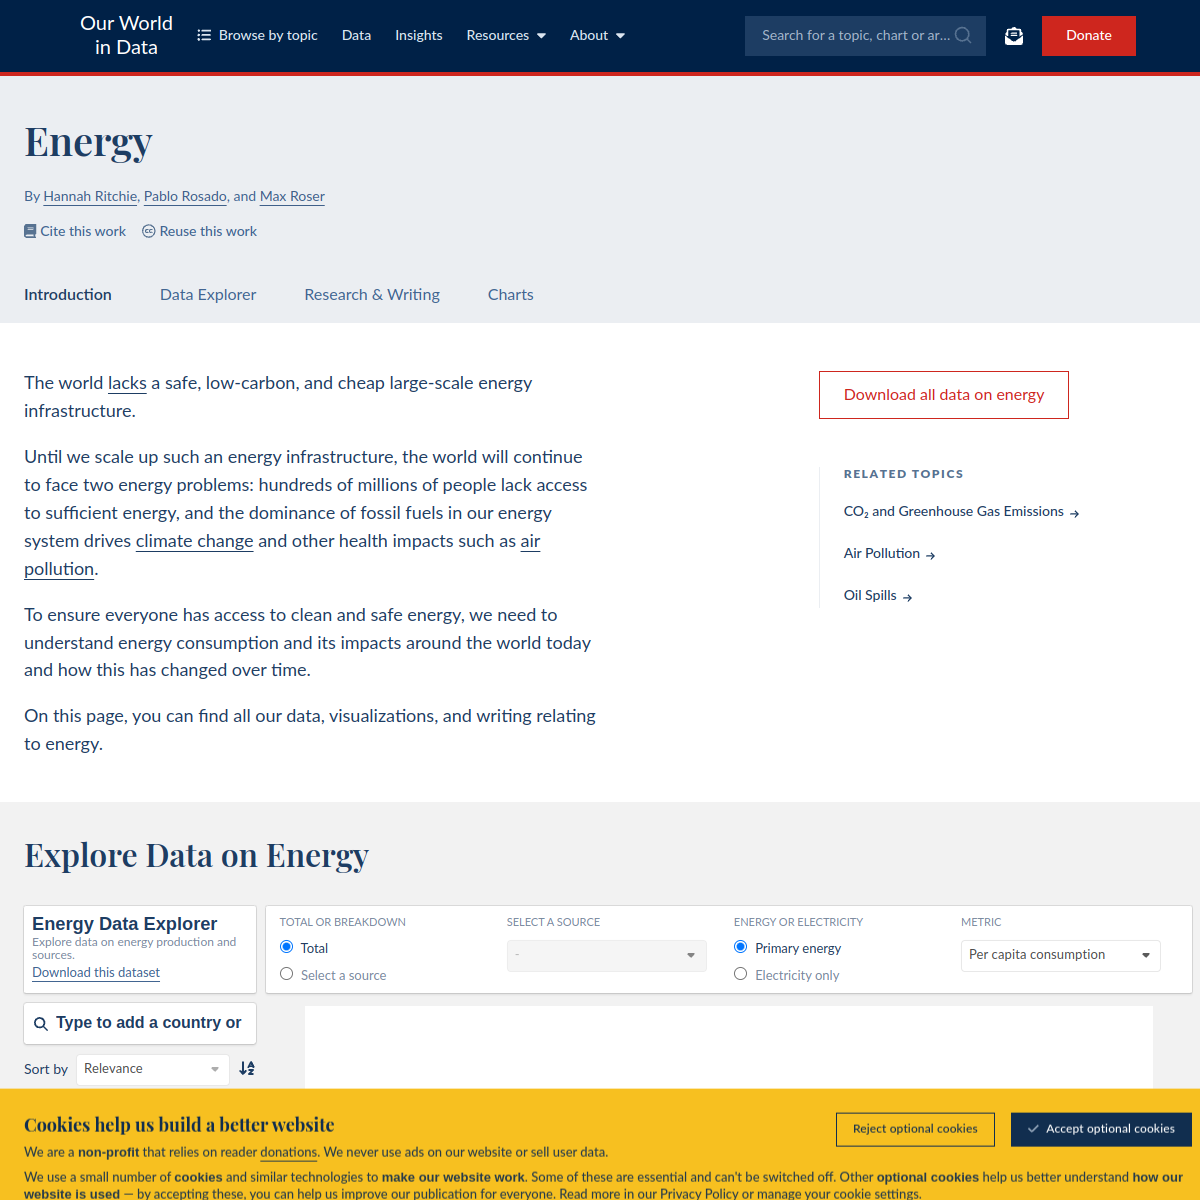
Our World in Data Energy
Data and research on global energy production and use.
PPTX
powerpoint file
 Alay-Merchant
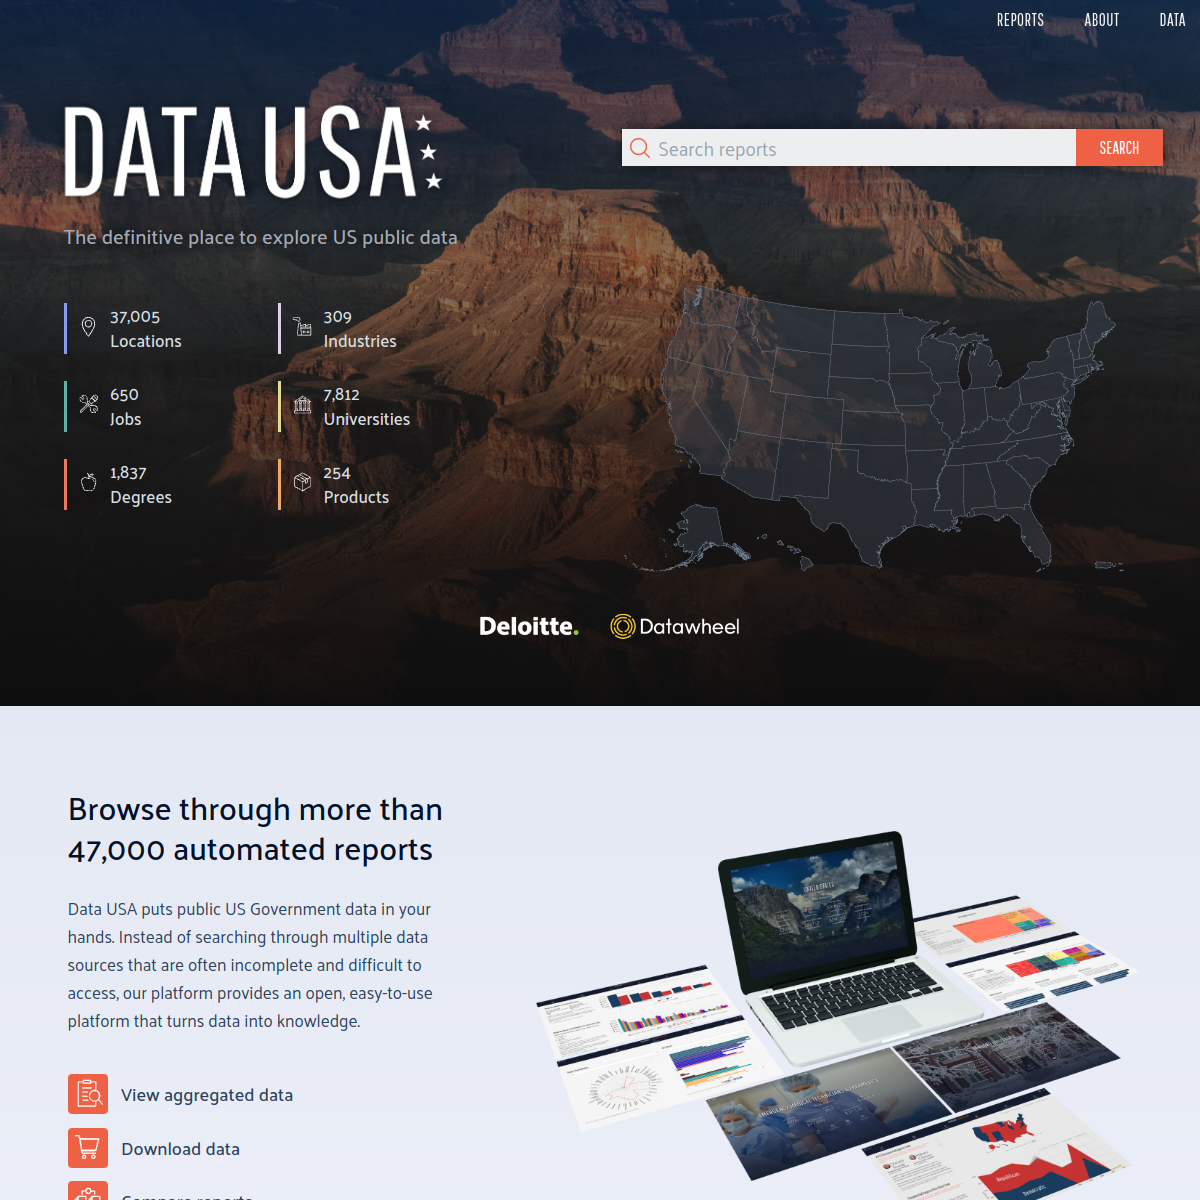
Data USA
Visualization of public U.S. data on jobs, education, health, and more.
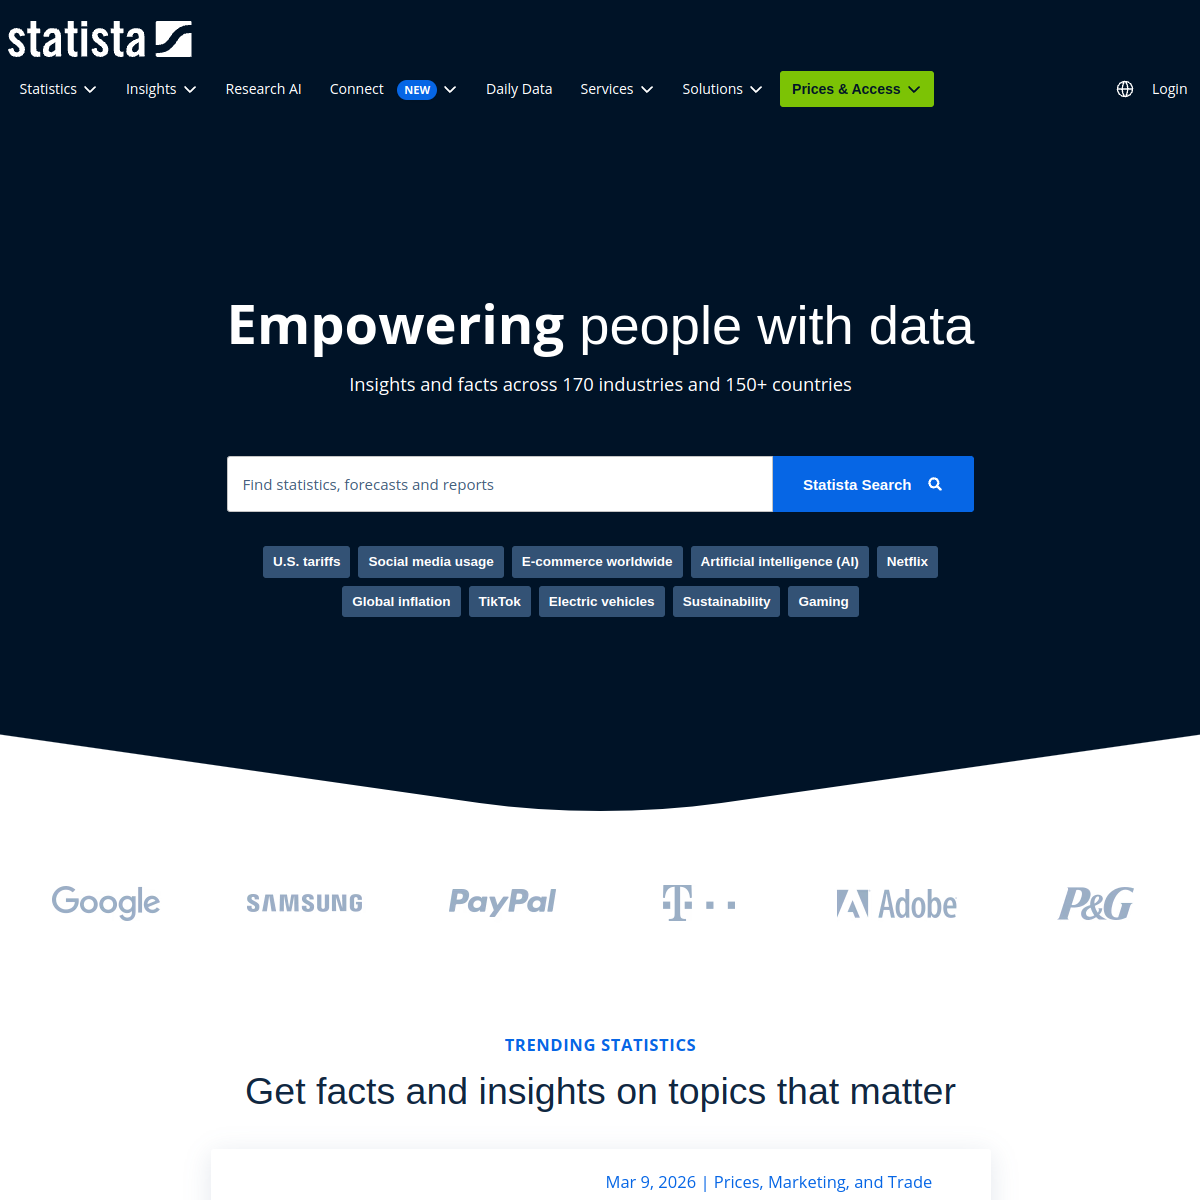
Statista
PaidGlobal database of statistics and market research.

Expatistan
Cost of living comparison calculator for cities worldwide.
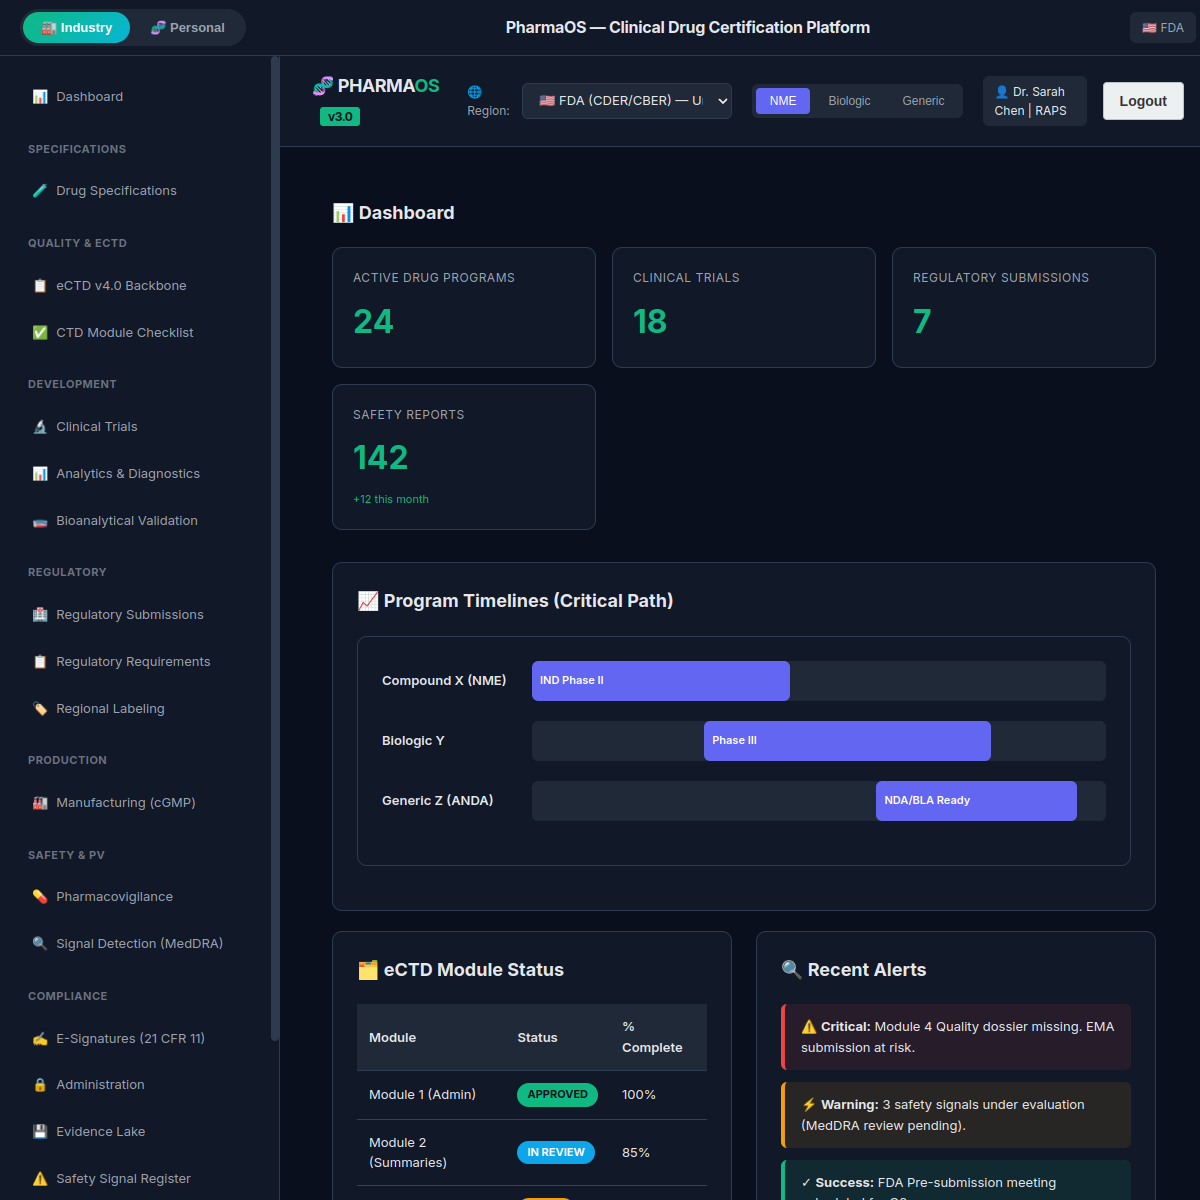
Industry & Personal Discovery Assistant
For Industry- Lifecycle management of Clinical Drug from Trials to Certification 7 Industrialisation For Individuals - Diagnostics for Dermatology issue via Image Analysis backed by ML models along with a wellness package for user and family
 Ateesh Hazra
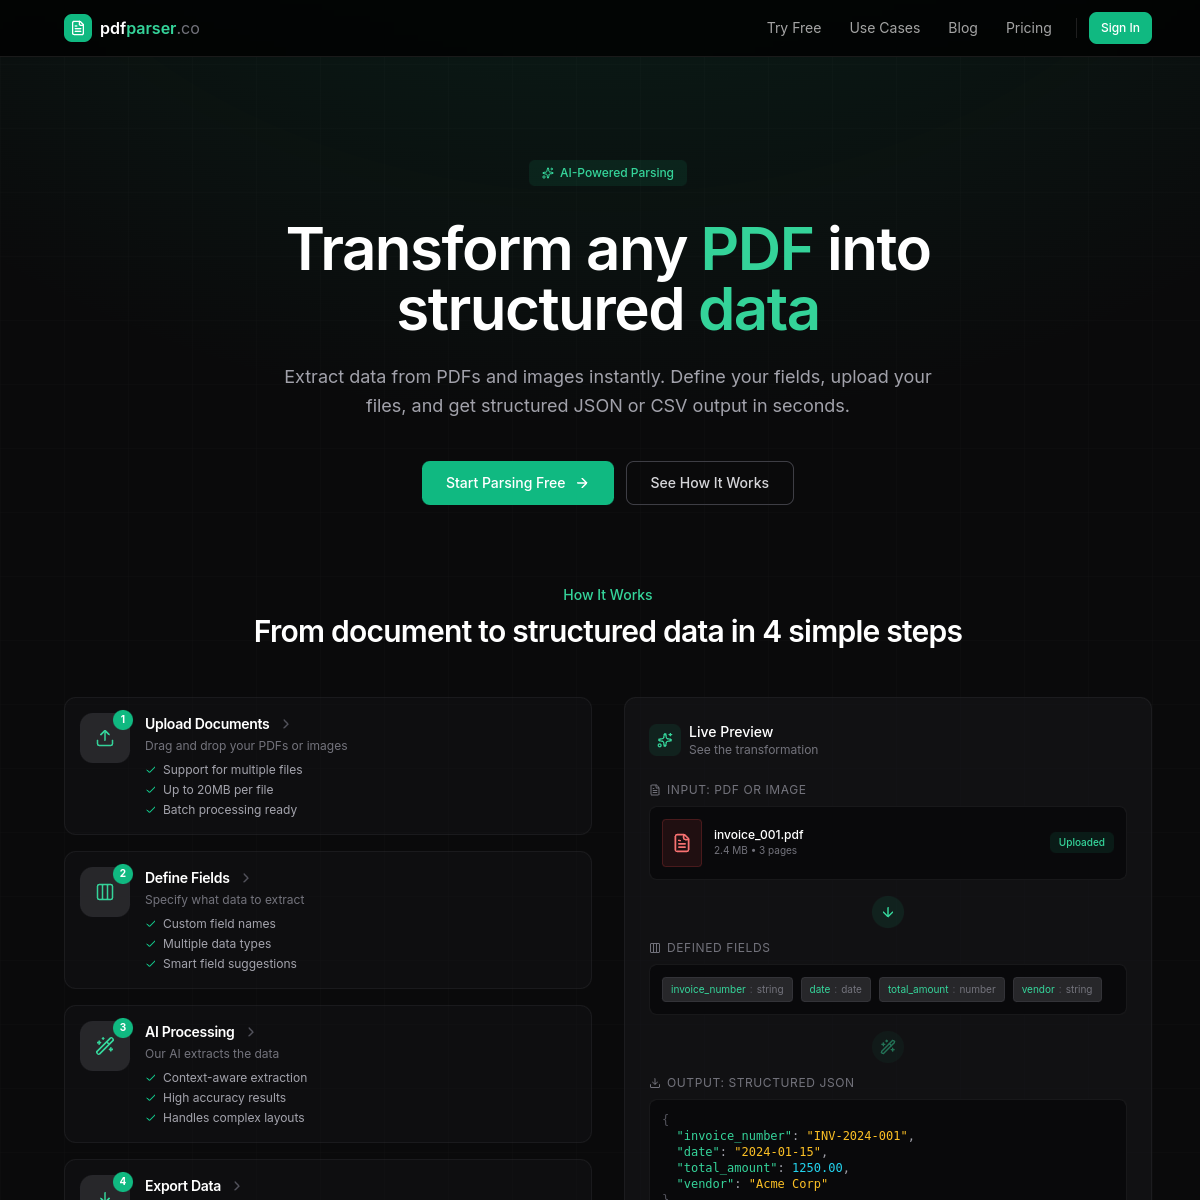
PDFParser
Online tool to parse and extract data from PDF documents.
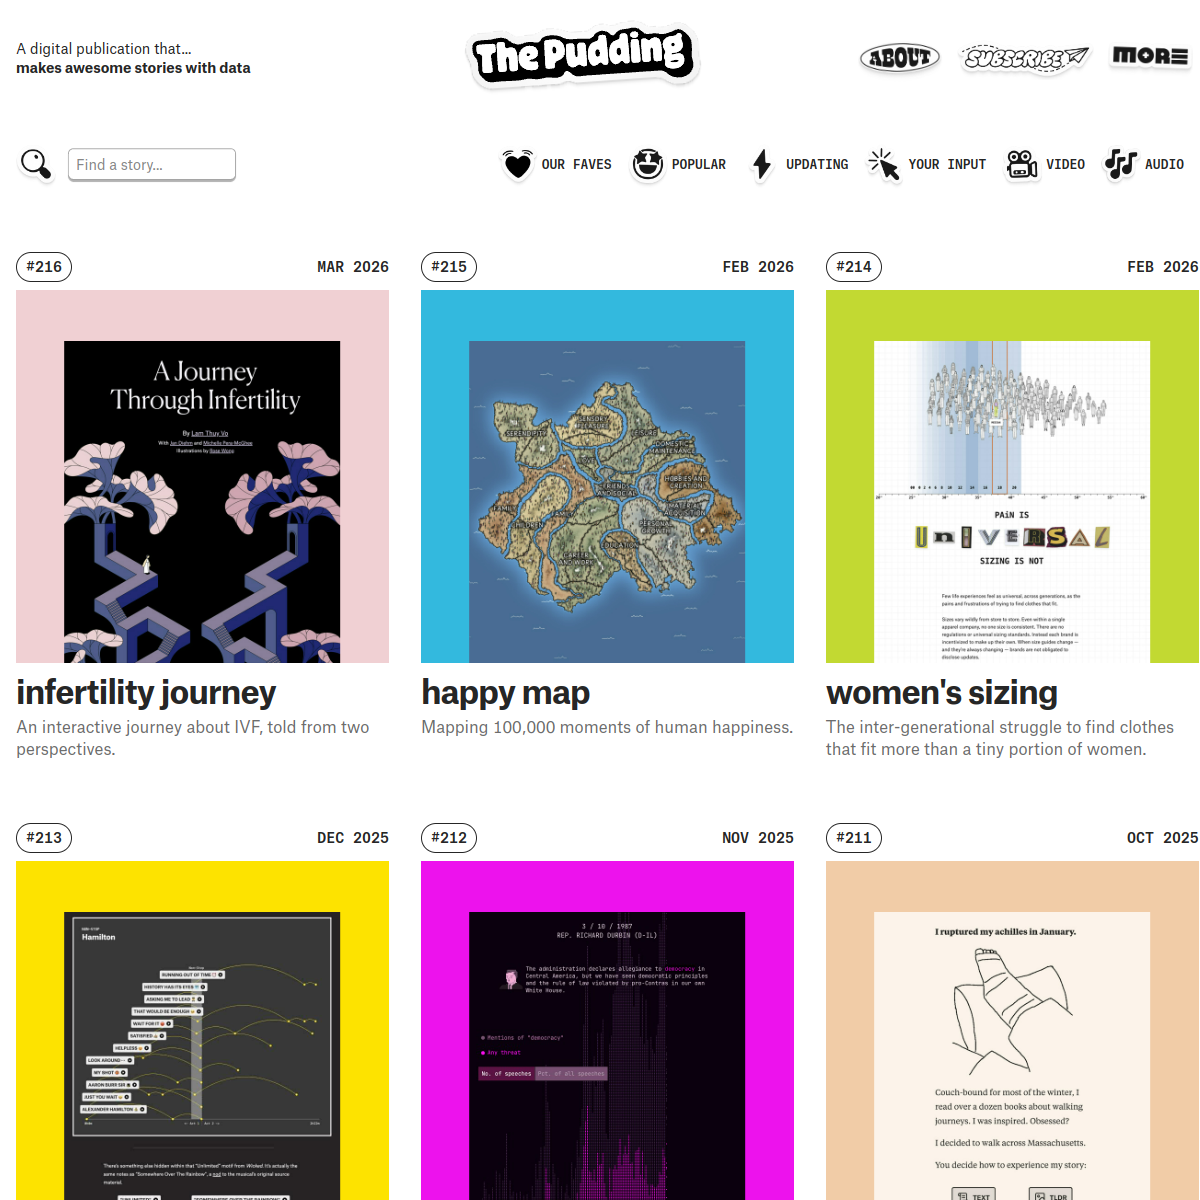
The Pudding
Visual essays that explain ideas with data visualizations and interactive graphics. Topics range from pop music to politics to pockets in women's clothing.
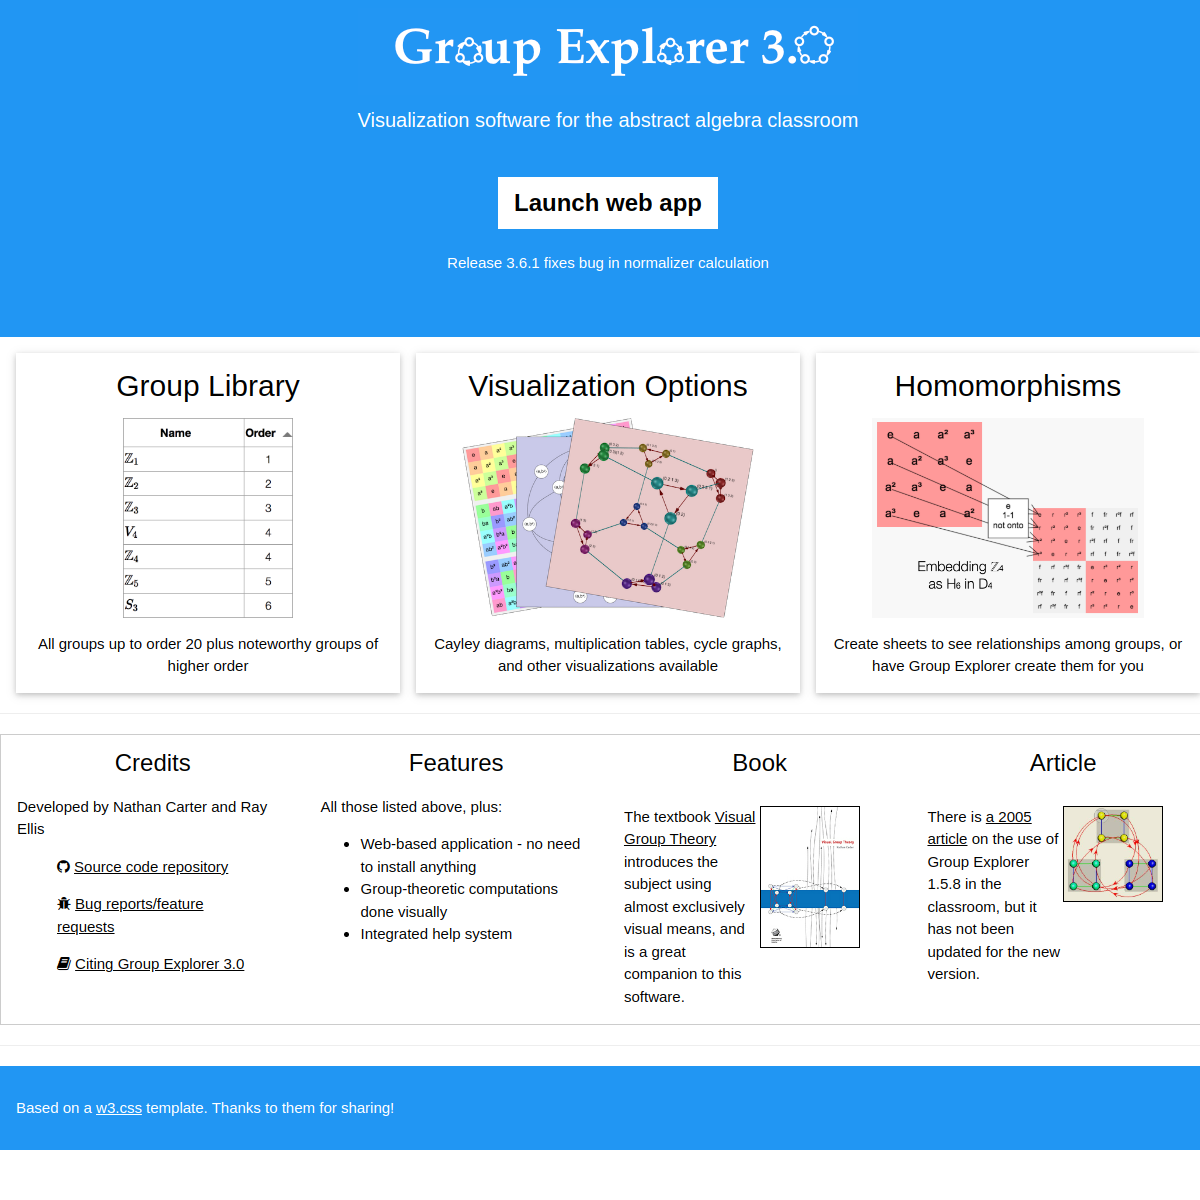
Group Explorer
Visualization software for abstract algebra. Explore symmetry groups, Cayley diagrams, and multiplication tables interactively. A mathematician's playground.

Differential Geometry Explorer
Garrett Lisi's interactive visualization of matter's intrinsic degrees of freedom. Spin beautiful geometric structures that represent fundamental physics.
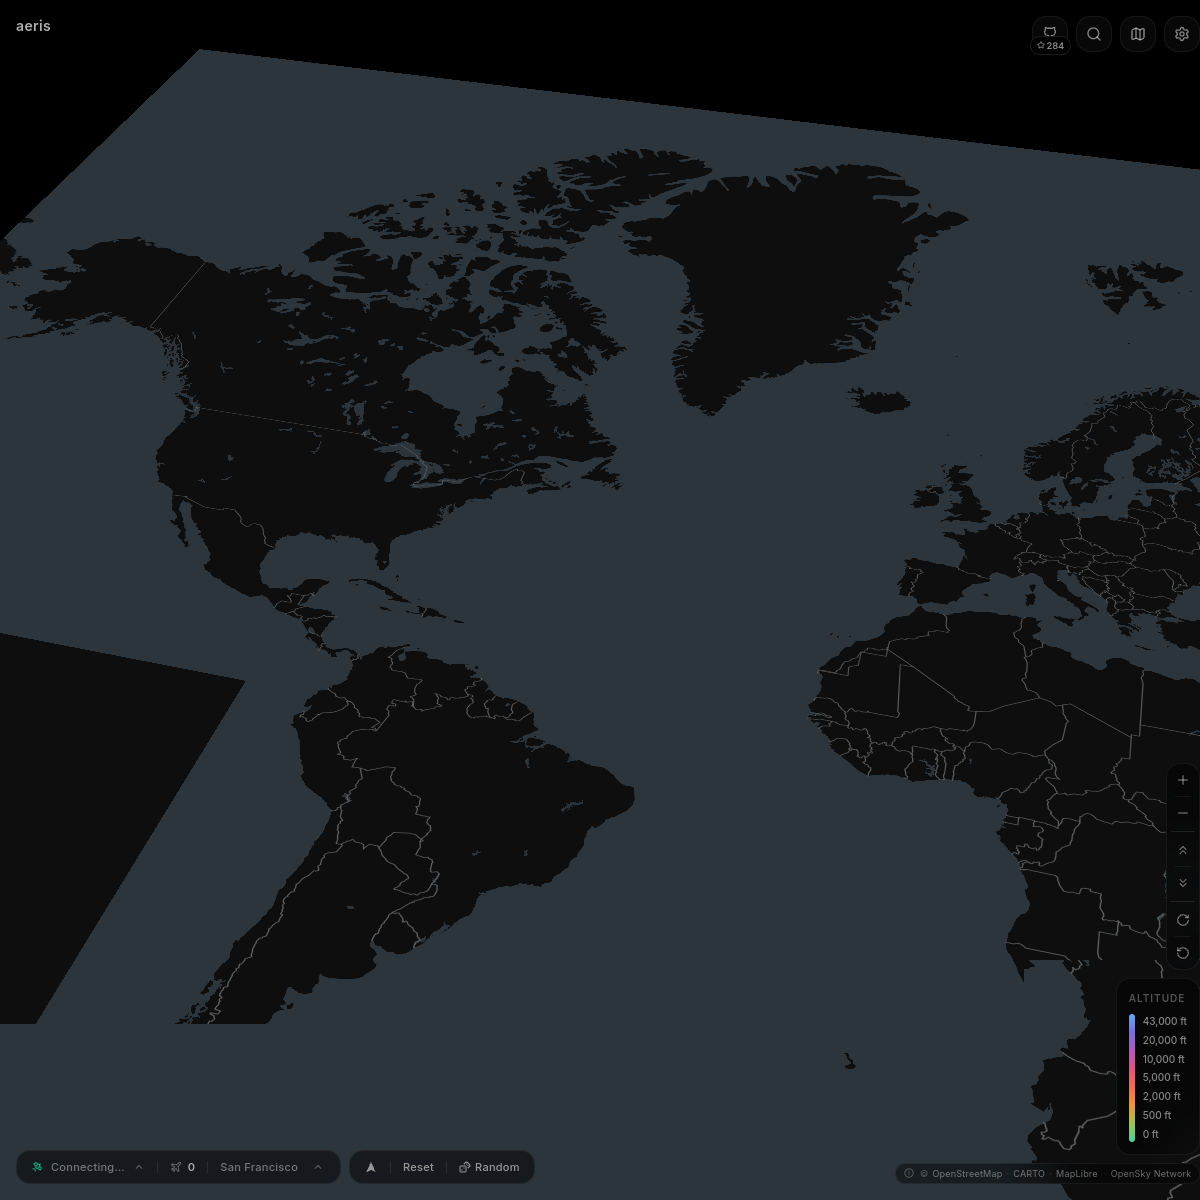
Aeris Flight Tracker
A flight tracker that separates planes by altitude using colors. Strangely satisfying to watch the rush at airports visually.
BatchGeo
Turn spreadsheets into interactive maps.

Still Here
A quiet, beautiful thing for when you've lost someone.
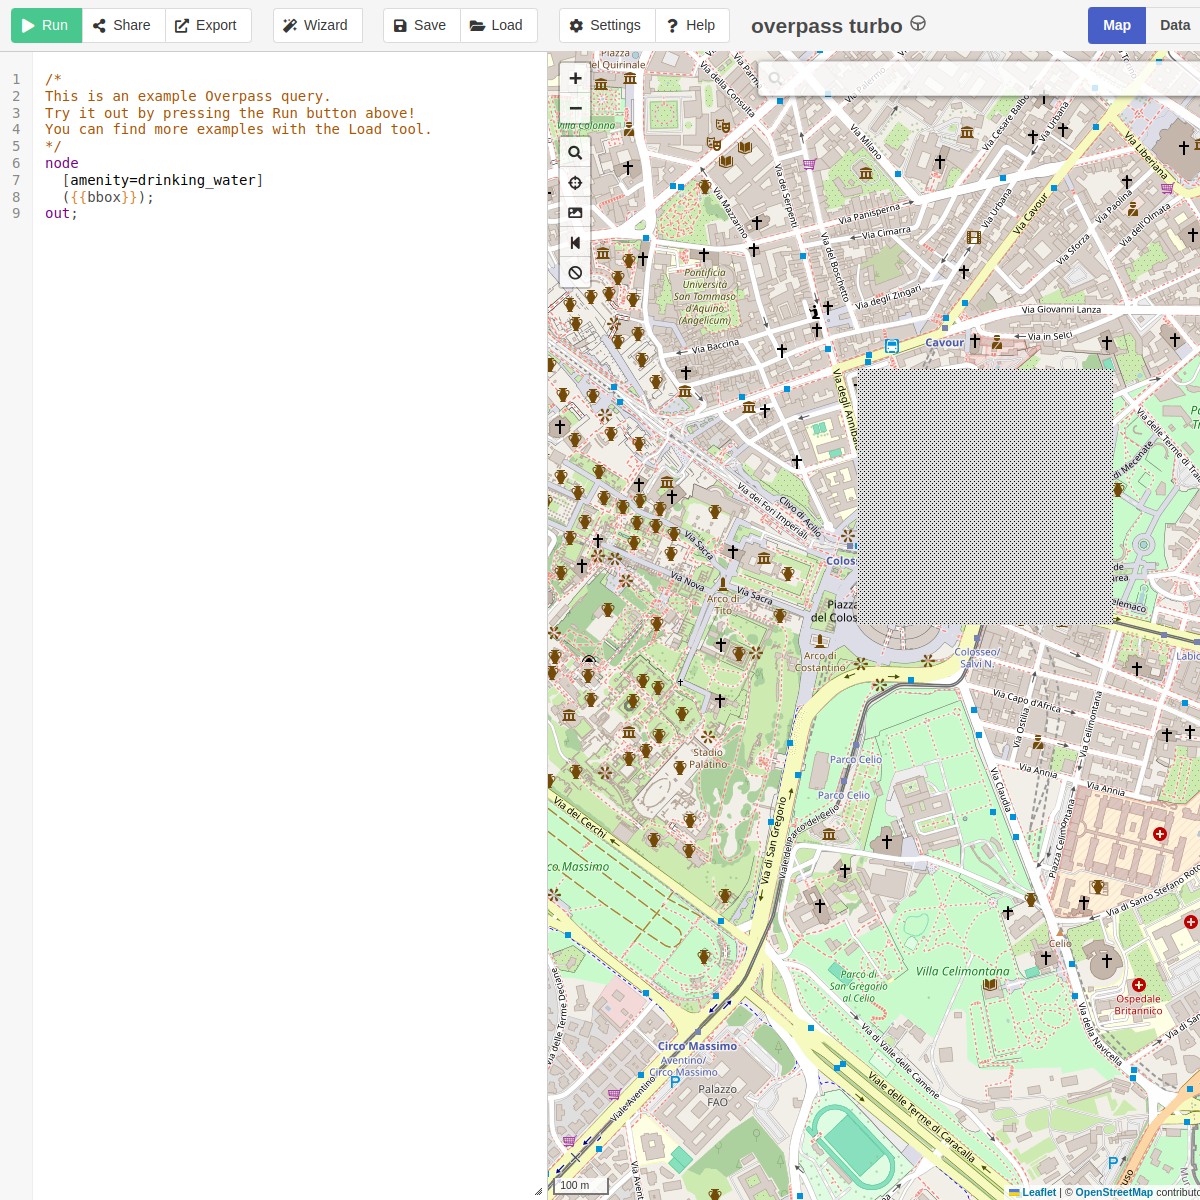
Overpass Turbo
Query and visualize OpenStreetMap data.

RepView
Look up any US House member and see exactly how they voted.

CIA World Factbook Map Viewer
Interactive world data and country facts from the CIA Factbook.
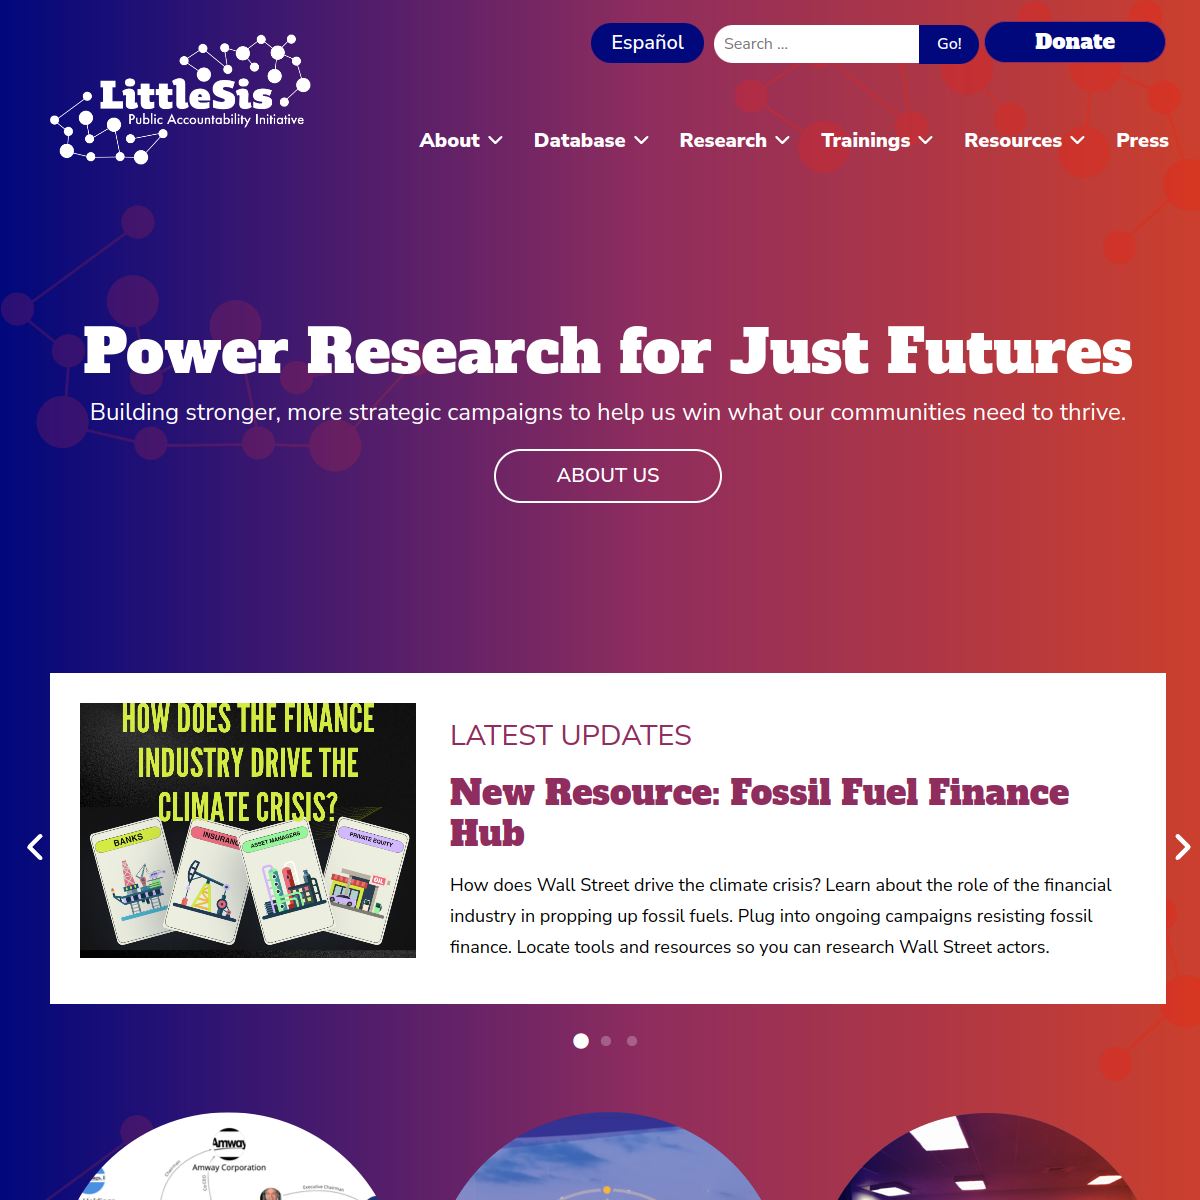
LittleSIS
A free database mapping the networks between powerful people and organizations in business and politics. Look someone up and see all their connections visualized.

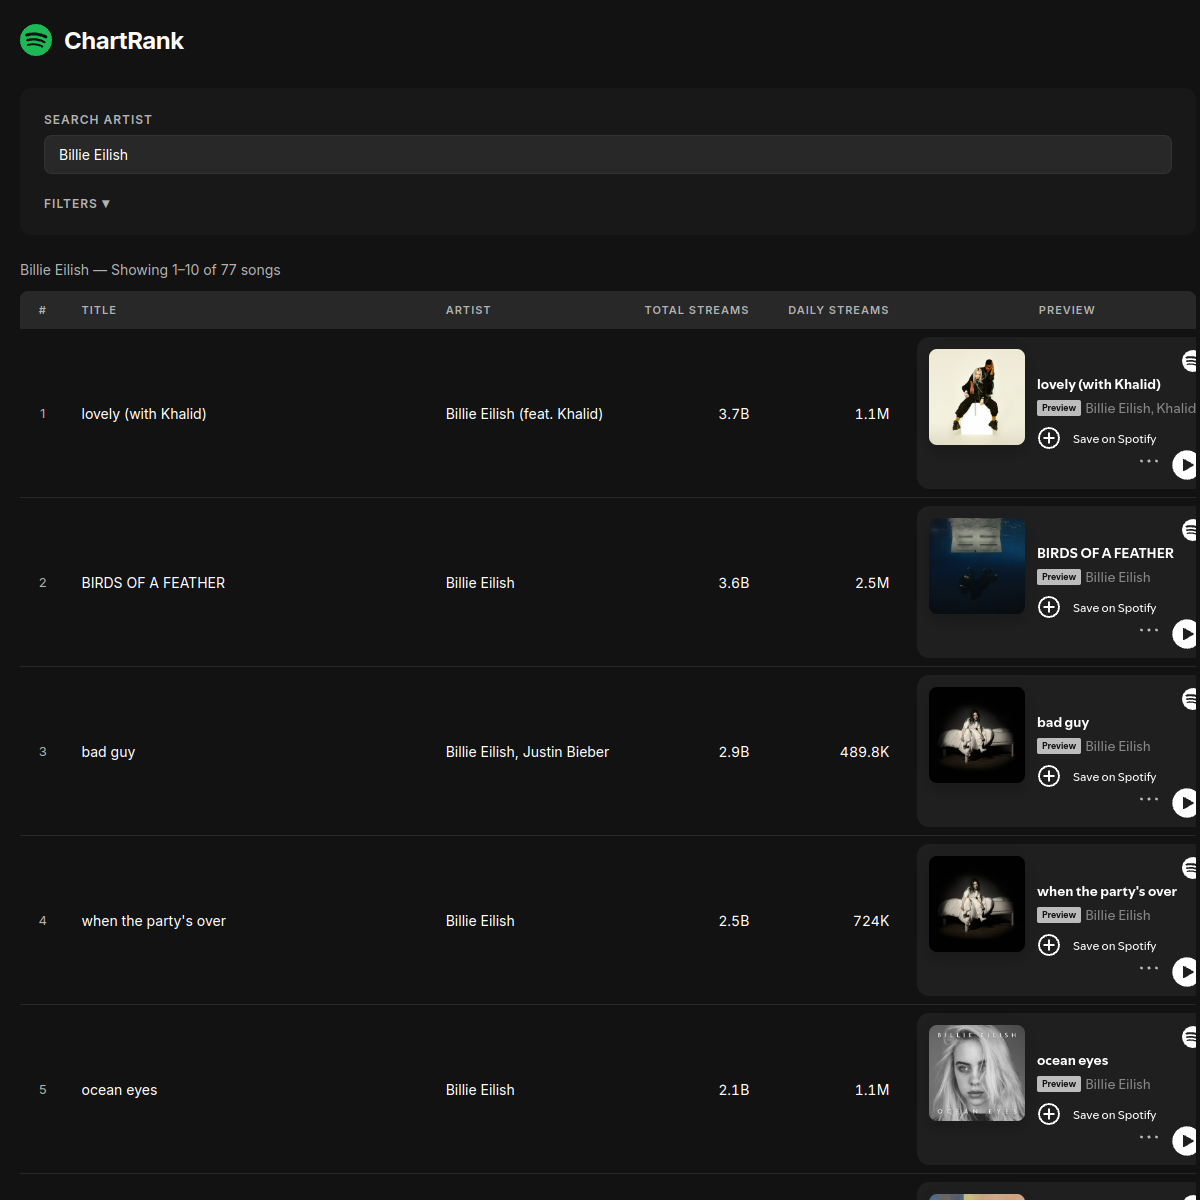
ChartRank
Spotify only lists 10 popular songs per artist — this tool lists them all. See every charting song ranked for any artist.
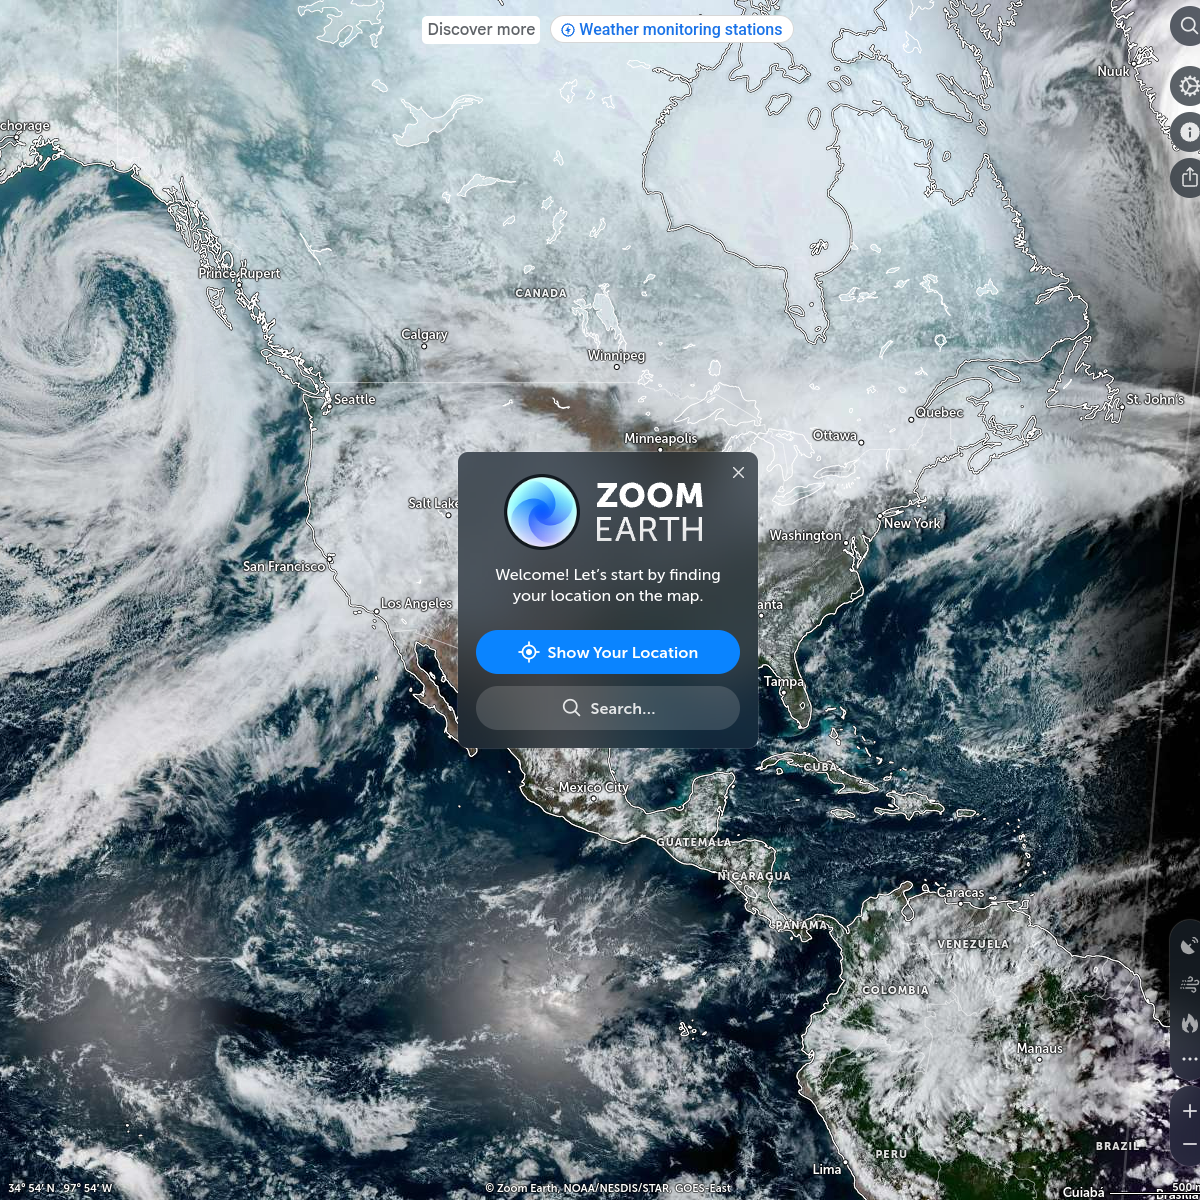
Zoom Earth
Live satellite imagery with storm tracking and weather overlays.
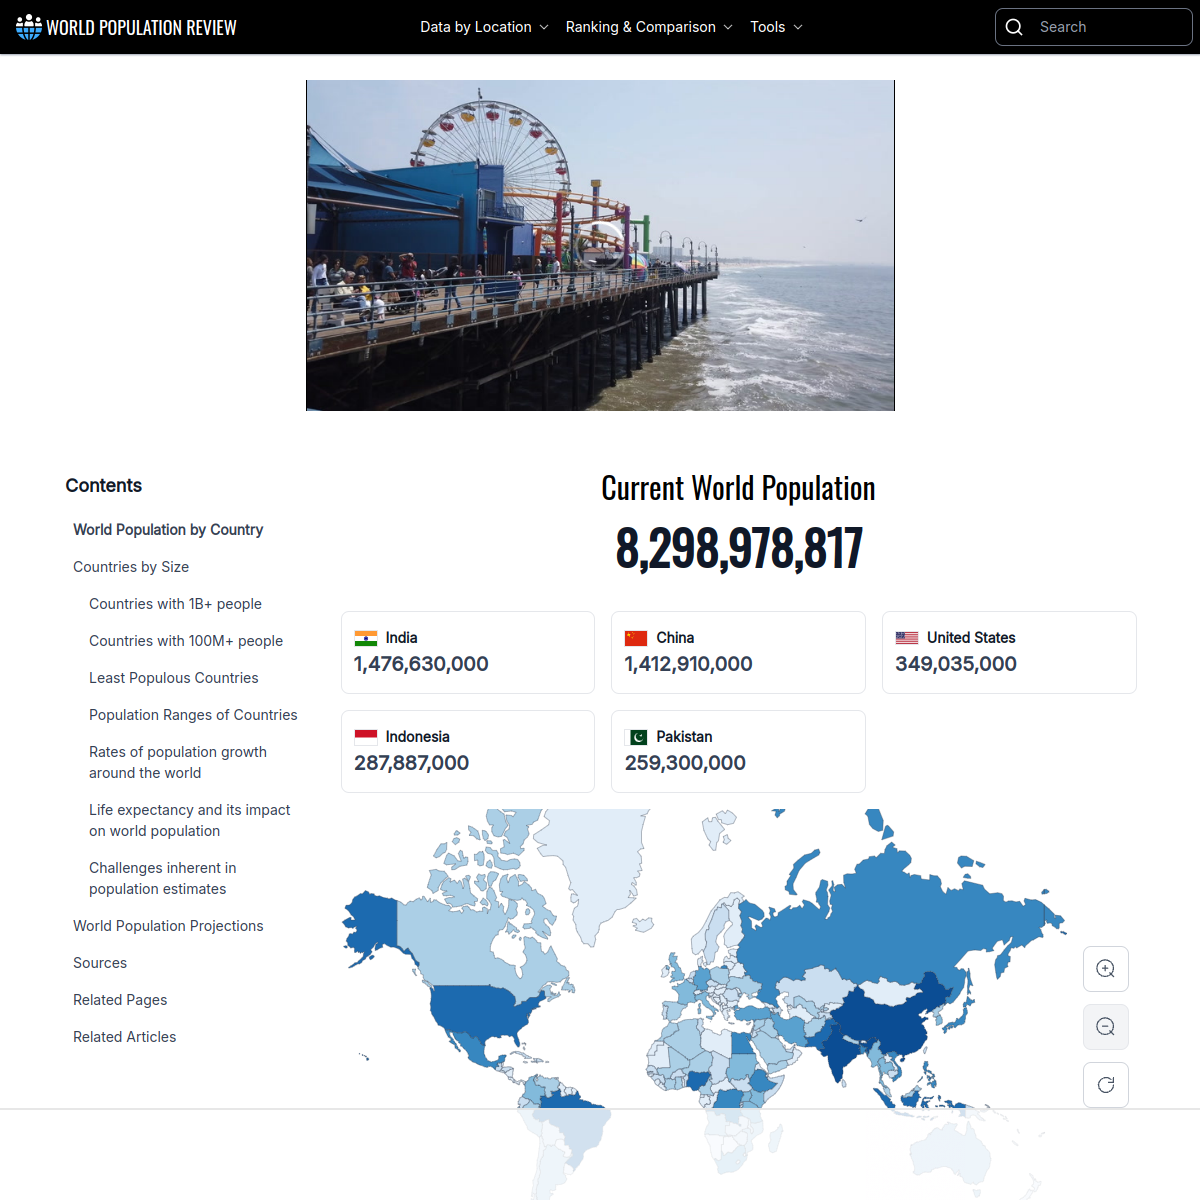
WorldPopulationReview
Up-to-date global statistics and country rankings.
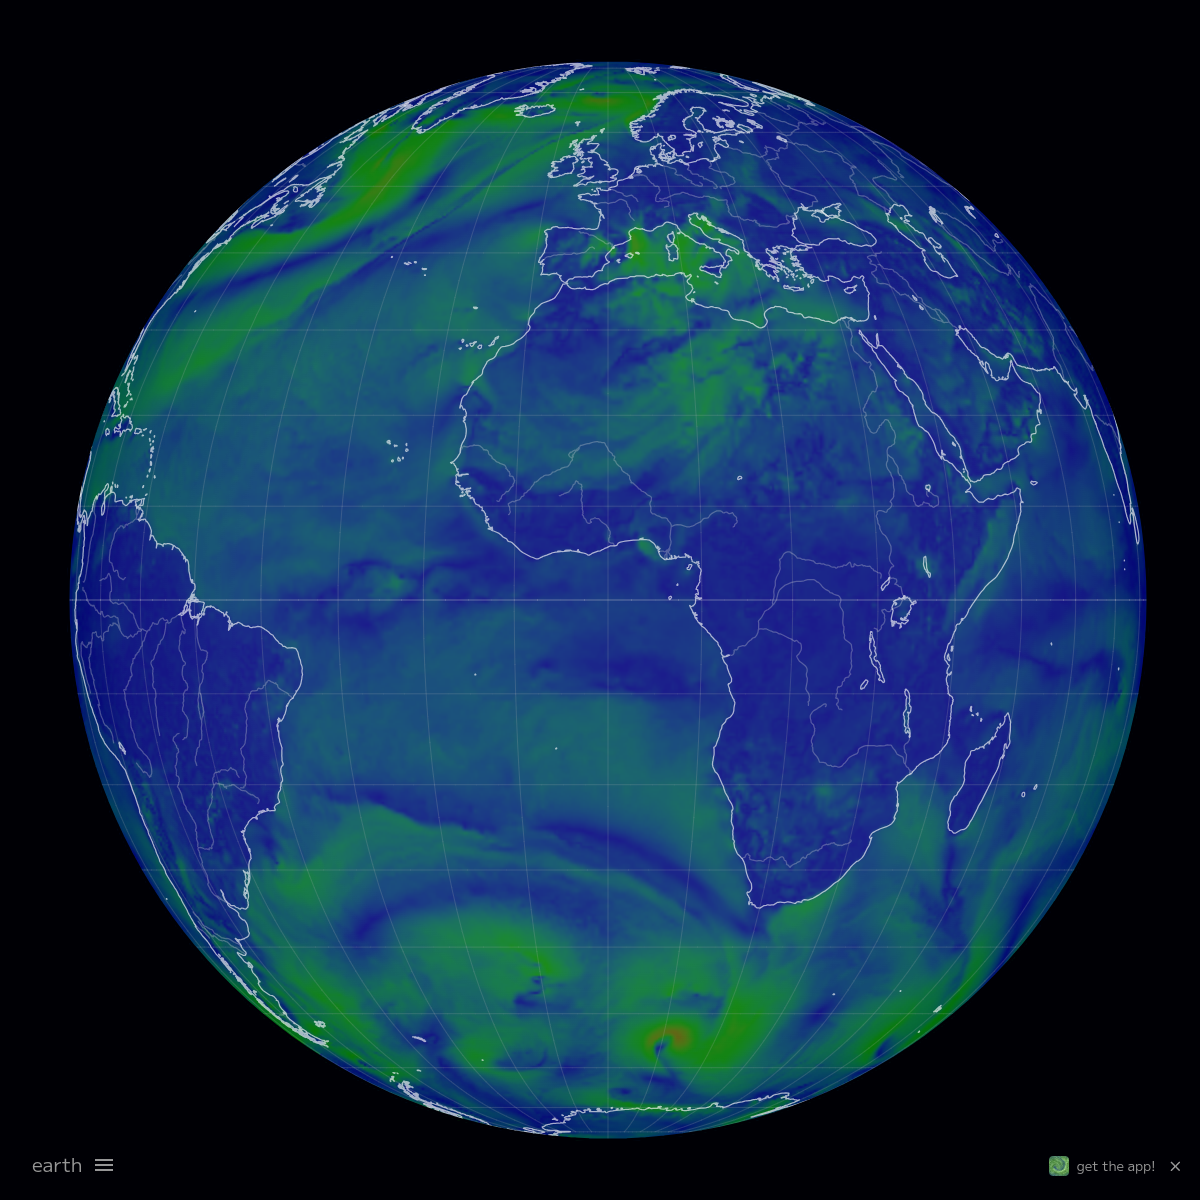
Earth.Nullschool
3D globe showing real-time wind, temperature, and ocean currents.

OpenCorporates
The largest open database of company information in the world. Look up any company to find past and present leadership, legal filings, events, and corporate structure.

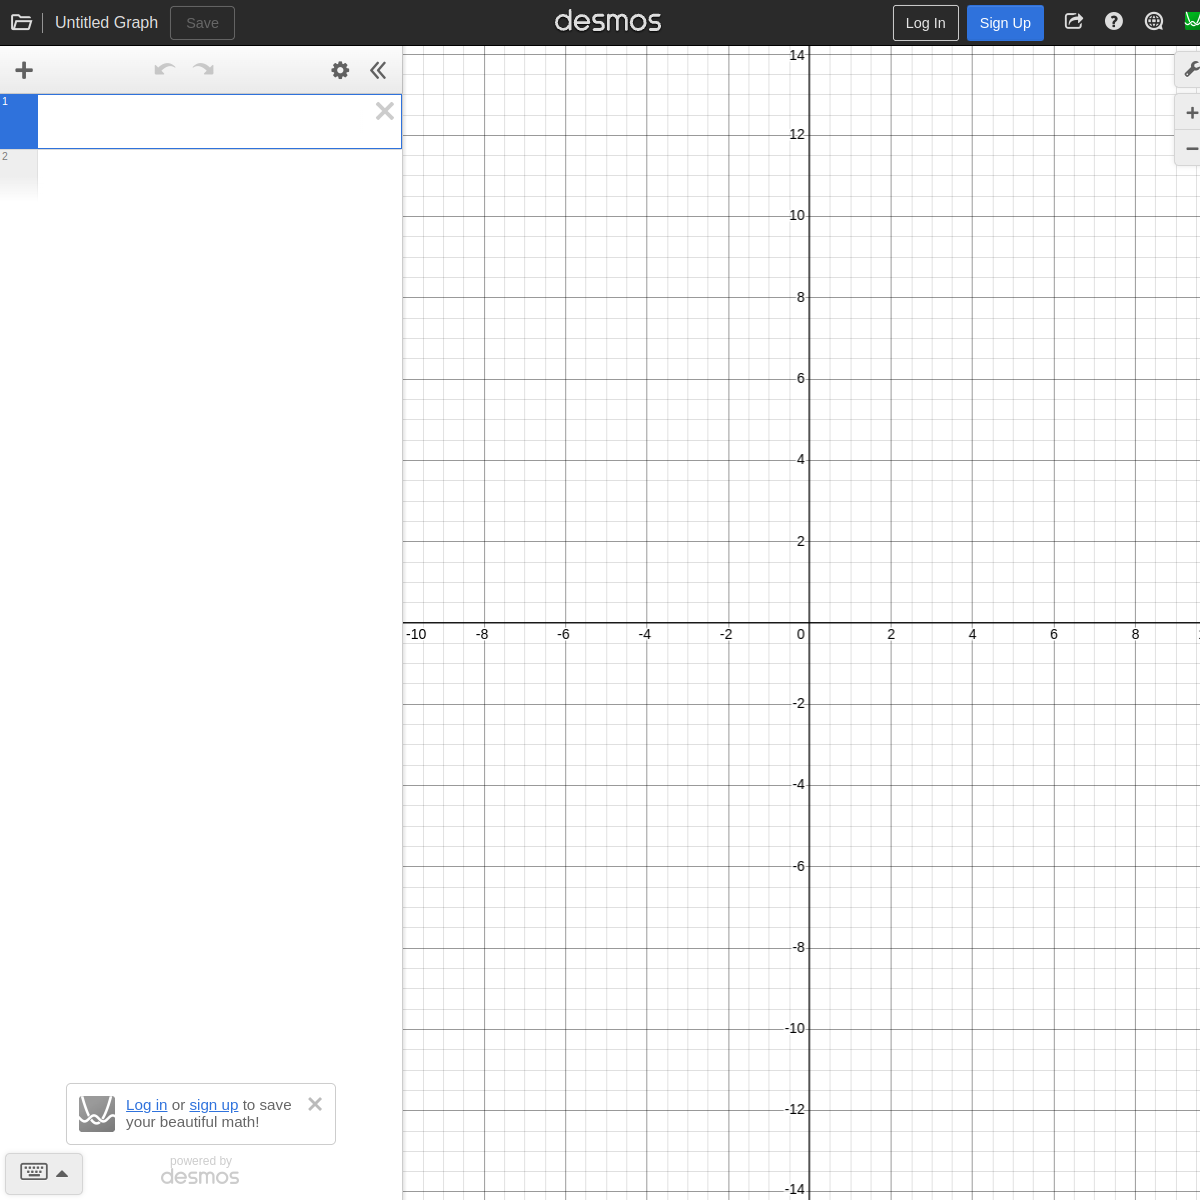
Desmos - Graphing Calculator
Desmos.com's calculator is a great tool for anyone in high school or university who is studying any subjects related to maths. The online graphing webpage will take any function you give it and display a clean graph. You can zoom in and out of the graph as much as you want and there is a helpful mathematical keyboard at the bottom of the screen to input more complex function symbols.